All posts by Tom Canfield

How will next month’s inflation affect the 12-month rate?

I wrote a prior post on inflation, but I think the two graphs I have in this post more clearly display how monthly inflation affects annual inflation.


== Each month replaces a prior month ==


The annual change in inflation is the compounding (proper multiplication) of the 12 prior monthly changes.


I think you have this, but it’s much easier for me to see on this graph: the most recent monthly inflation rate, replaces the same month of a year ago. The inflation rate for this July 2022 was -0.01%. It replaced the monthly inflation rate for July 2021 of 0.48%.


July ’22 replaced July ’21 for the 12 months used to calculate the 12-month inflation rate.


The 12-month inflation rate in June was 9.06%. This July replaced a higher prior July: the 12-month rate fell. The 12-month inflation rate for July was 8.52%.


The 12-month rate in July was 8.5% about .5% less than the 12-month rate in June.


The difference in the annual rate is not exactly the same as the subtraction of the rates in the two months: the math of compounding is the culprit.


== The next couple of months ==


The monthly changes in inflation in August and September 2021 were relatively low. That means monthly changes for this August and September will have to be darn low for the annual rate to decline. It’s easier to envision a measurable decline in the 12-month rate for October 2022 since the monthly rate in October 2021 was roughly four times the rates for August or September.


= Social Security (SS) COLA ==


When folks talk about inflation, they are using the measure of CPI-U – the Consumer Price Index for all Urban Consumers.


The SS calculation of COLA is based on the change of a different measure, CPI-W – the Consumer Price Index for Urban Wage Earners and Clerical Workers. COLA is based on the average 12-month change for the three month of July, August and September. We now have one month behind us. The 12-month change in CPI-W for July was greater than the change in CPI-U. That mean the three month change in SS will likely be greater than if it were calculated using CPI-U.


Conclusion: This post tries to help clarify how monthly inflation affects the 12-month inflation rate that you hear in the news. The inflation rate for the most recent month (July 2022) replaces the inflation rate for the same month from a year ago (July 2021). If the rate is lower now than the month it replaces, the 12-month rate declines. The 12-month rate for July declined by 0.5%.


Social Security bases its COLA (Cost of Living Adjustment) on a different measure of inflation that we hear in the news. COLA is the average the annual changes for July, August and September. The July 12-month rate was 9.12%. We might expect the COLA increase to our gross Social Security benefits to be in the 9% range.

How much does your suitcase weigh for two weeks of travel?

Patti and I leave for our trip to England next week. Over many years I’ve refined my list of what to wear on the plane and what to pack in my carry-on suitcase. This post shares my list. Lighter travel is better travel, and you may find my list helpful. I’ve packed 11½ pounds: that includes four pounds for my hiking boots, two sets of walking sticks and a small umbrella. Here’s my master list.


== Some generalities ==


No cotton or wool. Everything must be quick dry. Most everything is polyester or nylon. One of my polo shirts is cotton-poly, but it is quick dry.


Count layers for warmth. I could have six layers for warmth. Thin poly tee. LS poly tee. SS polo. ¼ zip. Fleece. Raincoat. Neck and head: neckband, thin fleece beany, baseball hat and sunhat.


Wash clothes every day. After hiking or being out for the day, I’ll shower and change into what I’ll wear for dinner. I’ll wash my very thin, stretch-poly undershirt, underwear, and the thin poly liner socks that I wore inside my hiking socks. I’ll wash them in the sink or in the shower with their body wash. I’ll dry those in a towel (roll and twist). They are usually dry before we go to bed. I’ll then wear the set I washed the previous night. I only have two pair of outer socks: hiking and black-poly crew; I’ll wash those infrequently.


== Things I like ==


Bluffworks pants. These are very comfortable and look great. These are my go-to pants all year round, and are not solely travel pants. (I order tailored-fit and smaller than my normal waist size; the waist band stretches.) I generally only spot wash them as needed. Especially with the one long-sleeve shirt I take, I never feel like we are poorly dressed for dinner. Bluffworks pants have lots of zippers, so my wallet is secure.


Two thin, poly-stretch undershirts. These are very comfortable under the polo shirt I wear when we are walking. Temperatures are typically in the 60s when we walk in England. I wash these daily, and I do not wash the two outer polo shirts that I take more than once.


Black poly quarter-zip shirt. I can wear this for dinner and look just fine. I wear my long sleeve collared shirt when we’re eating at a nicer restaurant.


Thin, black fleece. I bought one that I like for $12 in England about five years ago. It looks good enough to wear to dinner.


Sun hat. I wear one from Sunday Afternoons that I bought years ago. It may look funky, but it is the best for sun protection.


Collapsible walking sticks. Patti and I need these at our age. I need them for the boost when walking uphill, and we both need them for balance going downhill. The walking on this trip is very flat, but I’m sure we’ll start out using them and see how it goes.


Low cut hiking boots. I used to wear high top, but I like low cut now. Our hiking isn’t as challenging as years ago, and I only carry a day pack.


Osprey Talon 11 (11 liter) day pack. It fits like a regular pack in that I can tighten the waist band and put the weight on my hips and not my shoulders or back. I like the snap across my chest. I can carry my walking sticks. Patti thinks it is too small, but I get our lunches, water, and my rain jacket in it.


Gortex (or similar) rain jacket. Ours are from Outdoor Research. It has to breathe if you are hiking.


Conclusion. Patti and I are headed to England next week. Traveling as light as possible is more enjoyable for us. Over the years, I’ve refined what I need to take for two weeks international travel. This post provides my list. My suitcase has 11½ pounds in it. That includes 4 pounds for my hiking boots, two sets of collapsible walking sticks, and a small umbrella.

Have you completed your draft tax plan for 2022?

My tickler file (application) told me that this is the week for my first cut on my tax plan for 2022. I’m following my checklist that I provided in my blog post of January 28. The purpose of this post is to give you a spreadsheet you can use for your tax planning for this year; it’s similar to the one I provided last August and displayed in my post on February 4.


I try to solve a puzzle to avoid taxes that we don’t have to pay in our lifetimes. With planning I can avoid taxes now and much greater taxes in the future. You also may have a puzzle to solve, even if you can’t see it now. I can’t tell you if you have a puzzle or how to solve it, but this post describes my thinking on the puzzle and my tax plan.


== Our RMDs can increase significantly ==


I’ve discussed this before. If future returns match expected or long-run average returns, $RMDs will be much greater than they are now.


• The value of your traditional IRAs will increase in real spending power over time: your annual RMD% is below the expected, real return rate for your portfolio for many years – generally to your mid 80. I turned 77 this year. My  4.70% RMD% for this year is less than ¾ of the expected 6.4% real return on our portfolio.


• Your RMD% increases every year for the rest of your life. It increases by more than 50% from age 72 to age 85, as an example.


Combine these two effects and at about age 82, your real $RMD would be twice what you took age 72. And it doesn’t stop there. If you live to 92, your real $RMD would be four times the amount you took at age 72.


Patti and I are older. Our RMD%s are higher than at our start. When I run the math, it says our real $RMD could increase by 50% in eight years. If I live another eight years, it could be double our current RMD.


== Two taxes I want to avoid ==


• I want to avoid increased Medicare premiums. (I call that a tax.) This is a real possibility for the sole survivor of Patti and me.


• I don’t want either one of us to pay taxes in the 32% marginal tax bracket. I judge that that is too big of jump from the 24% bracket: I keep 11% less of income in that bracket relative to the 24% bracket. That would mean paying a very high taxes on money that is well beyond our spending desires. The start of that bracket is distant, but I want to be aware of it. (I don’t plan on heroic efforts to avoid the 24% marginal tax bracket relative to the 22% marginal bracket.)


== How to forecast our future tax return ==


I can judge the impact of greater $RMD by increasing our $RMD reflected in my 2021 tax return by 50% – line 4b of our tax return; alternately, I increase the RMD I have in cell C31 on the spreadsheet by 50%. The spreadsheet calculates to a greater MAGI and taxable ordinary income. I can then see if that MAGI has the potential to cross Medicare tripwires for a single taxpayer. I can then see if taxable income reaches 32% marginal tax on ordinary income for a single taxpayer.


== What can I do? ==


If I see Patti and I are near a Medicare tripwire this year, I can prudently use my Roth instead of sales from our taxable investment account to lower MAGI and dodge the tripwire.


If I have concerns about future Medicare premium tripwires and marginal taxes, the only way to avoid them is to get more out of our traditional IRAs now. That means I make a judgment that it is better to pay more tax now to avoid much more tax in the future. I should be happy to pay more tax now at the 22% marginal rate to avoid paying at the 32% rate in the future. More taxable income now could mean crossing Medicare tripwires in one year but avoiding them in for a number of future years.


You have three ways to lower the amount in your traditional IRAs; Patti and I have done all three to some extent. 1) You can convert traditional IRA to Roth. 2) You can donate from your IRAs earlier than you might otherwise plan to do. 3) You can withdraw more from your traditional IRAs and give the net to your heirs for their IRAs; the sum for you and them is, basically, no taxes paid: you pay tax, but they avoid tax, in effect,  on their contribution to their IRA.


== Steps I take ==


I list the steps for my tax planning on the template. My sheet differs slightly from the template. I don’t enter my SSA on the spreadsheet (cell C24). I will pay us less than my calculated SSA, as I described in this post. I enter our desired after-tax amount for our spending on my altered sheet. I then find the total gross security sales for that.


Conclusion. I complete a draft plan for our taxes the first week of August. The template I provide starts with your estimated SSA for 2023. You complete a spreadsheet that estimates total taxes for your 2022 return and the balance you will need to pay for the year. You then know the after-tax amount you have for your spending for 2023. You can jiggle with the three sources of cash to adjust your total 2022 taxes and your net for spending: sales of securities and withdrawal from your traditional IRAs; sales of securities in your taxable investment account; and sales of securities and withdrawal from your Roth account.


I think about future taxes, since our RMD could very likely increase by 50% in real spending power in a decade, and it could just be one of us alive then. I would like to avoid income levels that consistently trigger higher Medicare premiums and far too high of marginal tax relative to our spending desires. Solving this puzzle means incurring greater taxes now to avoid much greater taxes later.

How does the IRS calculate your RMD percentage?

The IRS publishes a “Uniform Life Expectancy” table to use for the calculation of Required Minimum Distributions (RMDs) from your traditional IRAs. The inverse of the years shown for your age is your RMD percentage. That table applies to all us while we are alive, and the table will apply to my IRA that Patti inherits on my death. The number of years in the table differs widely from a person’s life expectancy – mine from the table is more than double my life expectancy. Why is the difference so great? The purpose of this post is to describe how the IRS calculates your age-appropriate RMD percentage. I also describe that your RMD typically is much less than your annual Safe Spending Amount (SSA) that I calculate in Nest Egg Care (NEC) Chapter 2.


== Uniform Life Expectancy and your RMD percent ==


The IRS displays a “Uniform Lifetime Expectancy” for each age. The number of years for each age is also called the Distribution Period, and the inverse is your RMD percentage. See Appendix B, Table III here. All of us – married or not – will always use the age-appropriate Distribution Period – years – from the Uniform Lifetime Expectancy table to find our RMD percentage.


• Patti and I must use the age-appropriate Distribution Period from the “Uniform Lifetime Expectancy” table to determine our RMDs from our traditional IRAs.


• Upon my death, Patti will either rollover my IRA that she inherits into hers or keep my IRA in a separate account but elect to apply her age-appropriate Distribution Period for RMDs. (Rules are different if you inherit an IRA from someone other than your spouse.)


The years for my age in the Uniform Life Expectancy are more than double my life expectancy that I find from the Social Security Life Expectancy Calculator. Why is this?


== Calculating “Uniform Life Expectancy” ==


The IRS is calculating a life expectancy that is based on the assumption that there are two of you: you and your spouse who is ten years younger. The years calculated are roughly* the number of years for 50% probability for At Least One of You Being Alive. (A separate table applies if your spouse is more than ten years younger than you.) [*The IRS calculation is not quite as simple as the calculation of At Least One Alive that I describe in Chapter 3, NEC; this document explains the exact calculation, which is too hairy for me to understand.]


I turned 77 in 2022; the IRS assumes my spouse (Patti) will turn 67 in 2022. Patti will turn 75 in 2022; the IRS assumes her spouse (Tom) will turn 65 in 2022. My friend, Mary, is a widow, age 79; the IRS assumes she has a spouse age 69.


== Individual life expectancy ==


The IRS displays life expectancy for individuals in its Single Life Expectancy table. See Table 1, here. The IRS uses an average of the life expectancy for males and females. The table shows the life expectancy for a person who turns 77 in this year, is 13.3 years. This is about two years more years than I would get using Social Security’s Life Expectancy Calculator; I do not know why they differ.


The probability of At Least One Alive is always more years than the life expectancy of the one with the longest life expectancy. I explain this in more detail in Chapter 3 and Appendix E, NEC. The IRS’s life expectancy for a spouse ten years young than me is 21.2 years, but the number of years that is close to the point of 50% chance of At Least One Alive is 22.9 years.


As I read it, the IRS makes no underlying assumption about future return rates, but I would think the IRS is confident that their table of age appropriate RMD percentages ensures that a retiree does not run out of money in their life time. I think the objective is for the RMD percentages to be great enough for your spending to enjoy retirement, but not so high to run a chance of having too little RMD dollars from a seriously depleted portfolio.


== Nest Egg Care: SSR% ==


Nest Egg Care calculates a Safe Spending (or Withdrawal) Rate (SSR%) that eliminates the “return-sequence risk” in your financial retirement plan. NEC assumes that you are just starting to ride or have been riding along THE Most Harmful sequence of stock and bond returns in history and finds the spending rate that has Zero Chance of depleting for the number of years you pick.


Patti and I picked her life expectancy as the number of years we wanted for Zero Chance of depleting our portfolio throughout our plan. As we age, that number of years declines: her life expectancy was 19 years in late 2014, and at the end of this year her life expectancy is 13 years using the SS calculator. Our age-appropriate SSR% has increased, as have our RMD percentages.


Our age appropriate SSR% that I will test on for my calculation the first week of December is based on Patti’s 13-year life expectancy: 5.30% (See here and Graph 2-4 and Appendix D, NEC.). That’s roughly 26% greater than the average our RMD percentages.


== RMD% could ~equal your SSR% ==


It turns out, by accident I think, that if your spouse is ~ten years younger, your SSR% is close to your RMD%. My RMD percent is 4.37%. Our SSR% is based on Patti’s life expectancy. If she was 69 – nine years younger than me – her life expectancy would be 19 years and that equals SSR% of 4.40%. See Appendix D, NEC. (My example may be a total coincidence; I’ll play with this in a future post.)


== $RMD << $SSA ==


I think you get this: the dollars you withdraw from your traditional IRA will be much lower than the dollars you withdraw from your nest egg as your annual Safe Spending Amount using your SSR%. RMD% is applied to your traditional IRAs, while your SSR% is applied to the total dollars in all your Investment Portfolio: your taxable account; your Roth IRA accounts; and your traditional IRA accounts.


Conclusion. The IRS calculates a Required Minimum Distribution (RMD) percentage that you must withdraw from your traditional IRAs each year. The percentage is the inverse of a Distribution Period (years) that the IRS displays in a table, “Uniform Life Expectancy.” The years displayed in the table are many more than your life expectancy that you can find on the Social Security Life Expectancy Calculator. That’s because the IRS always assumes you are couple and your spouse is ten years younger than you, and it’s calculation is based on the chances of “At Least One Alive”.


For many of us, the RMD% is significantly lower that the Safe Spending Rate (SSR%) that one finds in Nest Egg Care. Our Safe Spending Amount using our SSR% is always much greater than the dollars of RMD: we nest eggers apply our SSR% to our total Investment Portfolio, while the IRS requires us to apply the RMD% only to our traditional IRA accounts.

Where might this year rank in returns?

I don’t need to tell you: stocks have nosedived. Bonds usually work as insurance, meaning their returns have averaged 27 percentage points better than stocks when stocks crater. Bonds clearly aren’t providing their historical value: they’ve nosedived, too, and are only 8 percentage points better than stocks. This post displays the possible rank of 2022 among the 15 worst years for stock and bond returns since 1926. It shows that 2022 would rank as the fifth worst year just based on the YTD results. NOT GOOD.


The returns have to be disturbing if you’ve recently started on your retirement plan; it’s less disturbing when you look back over the past several years: even with this sharp drop, all of us have experienced above average returns over the past 3½ years.


My worry-point is ~19 weeks from now. That’s when I’ll sell securities for our spending for 2023. Hopefully both stocks and bonds recover. I’m remaining calm – for now.


== Returns so far this year ==


I’ll use the real return for an index fund for S&P 500 stocks (VFIAX) through June: -19.98%. (The return as of yesterday is better.) I’ll use an index fund that basically is an intermediate bond fund (IUSB) through June: -10.79%. The six-month inflation rate has been 6.28%. Real returns for the first six months are -24.7% for stocks and -16.1% for bonds.


== How would this compare? ==


I assume full year results equal the six-month results. That means no improvement or further decline for the balance of the year. I then compare that pro forma result to the worst 15 years since 1926. I pick the results of a portfolio mix of 80% stock and 20% bond to display and rank the years.


One horrible year certainly is not good, but what really sinks a portfolio is a grouping of really bad years. I highlighted the start of the three most harmful sequences of return: they all started with a year that ranks in the worst 15. The worst of the three is the sequence that starts in 1969. That sequence is the worst-case scenario that drives your Safe Spending Rate (SSR%. Chapter 2, Nest Egg Care [NEC]) to a low level.


If one just looked at stocks, my pro forma 2022 would rank fifth worst since 1926. Bonds would rank as worst on this list. The stinky bond returns so far this year follow smelly real returns for 2021: -8.9% real return; the combination of the two years would be -23.5% real return. That’s the worst in history. The next worst two-year period for bonds was -20.9% (1946 and 47).


== If you’ve just started your plan ==


Results so far have to be disturbing if your just started your plan –  you made your first security sales/withdrew in late 2021 for your 2022 spending from your nest egg. However, we all can look back a couple of years and be less upset because stock returns were outstanding in 2019, 2020 and 2021. Portfolio returns, even with this decline, are about one-half percentage point greater than we would expect based on long-term average returns.


I can’t predict the results for the balance of the year. Returns obviously have to be pretty darn good for the rest of 2022 to not rank in the 15th worst of the 97 years since 1926.


Conclusion: Both stock and bond returns have been very poor for the first six months of the year. If the YTD returns turned out to be the 2022 full-year results, the year would rank as the fifth most harmful to a portfolio. If we look back and include the prior three years, however, we find the average annual portfolio returns have been about one-half percentage point greater than what we would expect. I have about five months before I need to sell securities for our spending in 2023. Ideally, stocks and bonds recover, and we don’t have to sell at seriously depressed values.

How do you disburse and invest if you have “More Than Enough”?

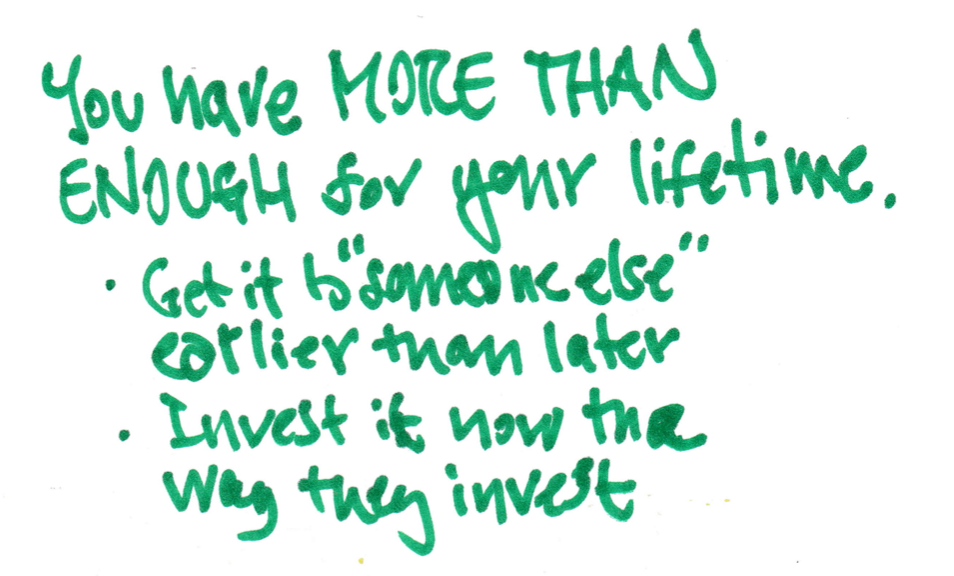
The last several posts described how you get to the number that is ENOUGH for your spending for the rest of your life or lives. See here, here, and here: after going through that math, I find that Patti and I are Happy Campers that I describe in Chapter 10, Nest Egg Care (NEC). We have MORE THAN ENOUGH portfolio value needed to support our desired spending for the rest of our lives. You may be Happy Campers now or maybe you will be in the future. In this post I recommend that you do not hold onto your MORE THAN ENOUGH for the rest of your lives, and I recommend how I think it should be invested.


Here are the decisions . . .


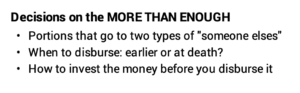
1) What portion of MORE THAN ENOUGH should go to charities you like and what portion should go to your heirs? Patti and I have earmarked some for charities and some for heirs.


2) When will you disburse to them? Patti and I decided we’ll disburse our current MORE THAN ENOUGH over the next three to five years. Odds are that in five years we’ll calculate to another MORE THAN ENOUGH amount that we can donate or give.


3) How do you invest? The MORE THAN ENOUGH that you designate for heirs has to be invested 100% in stocks. I decided the MORE THAN ENOUGH that we designate for charities should be invested as 70% stocks and 30% bonds.


== The last several weeks ==


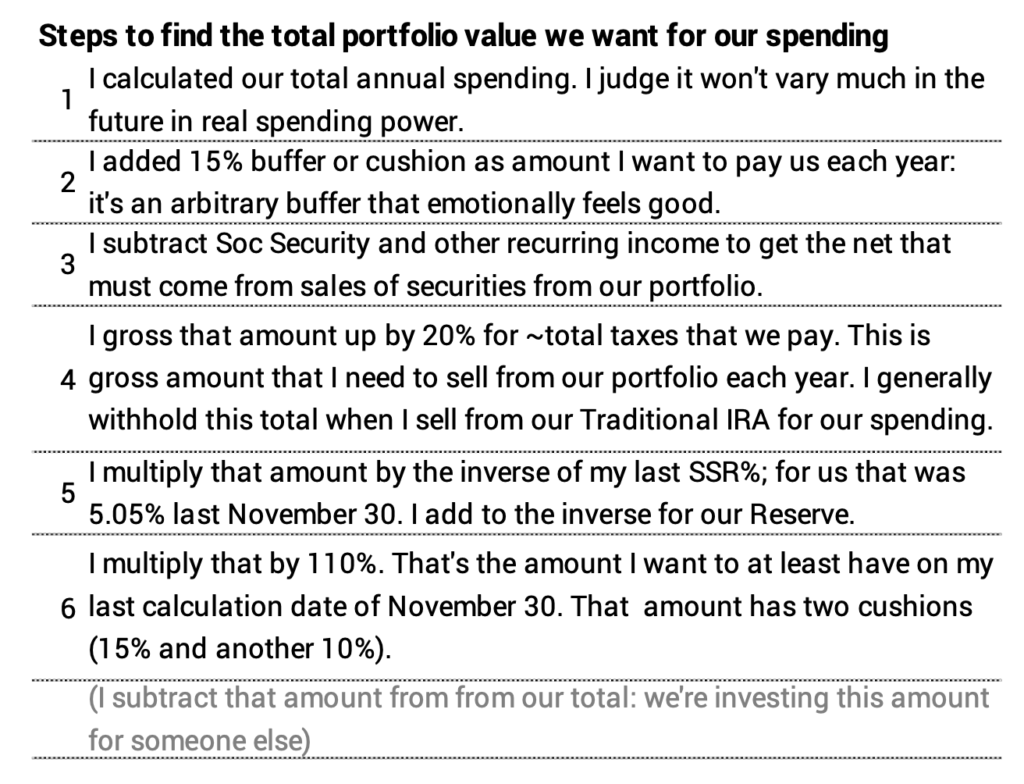
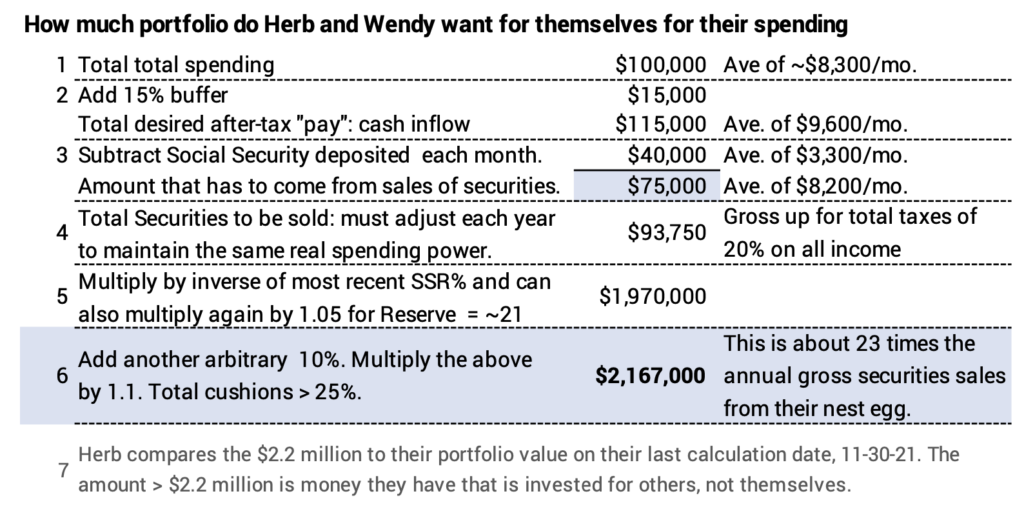
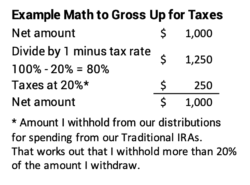
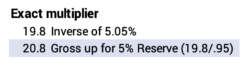
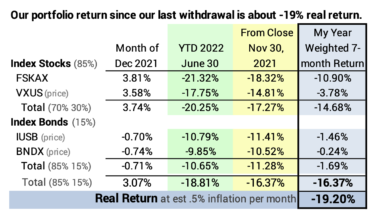
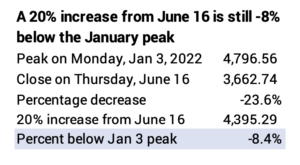
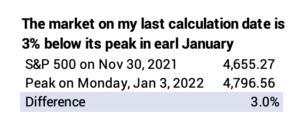
I figured out how much Patti and I spend in a year. I judged it won’t increase significantly in inflation-adjusted dollars for the rest of our lives. I calculated how much we need in portfolio value – ENOUGH for the rest of our lives – basically by using the inverse of our most recent Safe Spending Rate (SSR%. See Chapters 2 and 10, NEC). (I added in two cushions to the calculation.) The total we had on our last calculation date – last November 30 – was greater than ENOUGH. That “excess” is the MORE THAN ENOUGH that I address in this post.


== Where is the MORE THAN ENOUGH? ==


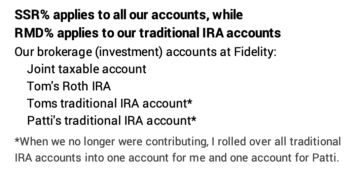
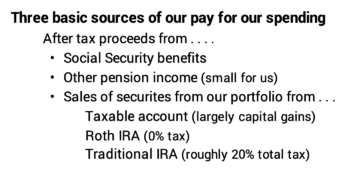
The MORE THAN ENOUGH for Patti and me sits in our Traditional IRAs. NONE of it sits in the 15% of our total that is in our  taxable investment account or in my Roth IRA; the money in these two are low-tax sources for our spending in our lifetimes: those are the prime sources I tap for our spending after we’ve made our RMD distributions.


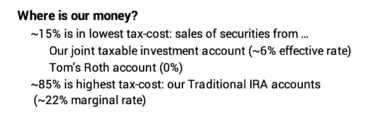
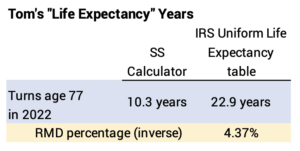
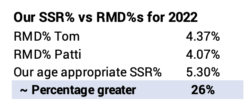
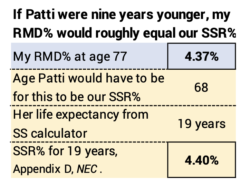
I’m very careful about using our low-tax-cost sources for our spending. Our SSR% is always greater than our RMD%; our SSA is always greater than our RMD. (SSA = Safe Spending Amount; see Chapter 2, NEC.) Each December I sell securities for our spending for the upcoming year from our taxable account, and I primarily sell from my smaller Roth account if it helps to avoid higher Medicare premiums.


Since our SSR% is always greater our RMD%, I proportionately sell more securities from my low tax-cost sources. Over time, our low-tax-cost sources are a shrinking percentage of our total. That pattern will continue as I work to minimize the taxes that Patti and I pay in our lifetimes. If we live long enough, those two low-cost sourcesn, now at 15% of our total, could get close to 0% of our total. All of our spending then will be from sales of securities from our traditional IRAs; our total tax rate will be higher then, but I’m thinking that’s when we’ll be in our 90s and our spending needs may be far less – knock on wood that we are still around and healthy.


== Who is it for? ==


The MORE THAN ENOUGH isn’t for Patti and me. It’s for someone else. There are two possible “someone elses”: charities or people – our heirs; Patti and I decided on portions for each. Once you’ve decided the MORE THAN ENOUGH for those two, you then have to decide when you give the MORE THAN ENOUGH to them.


== Charities ==


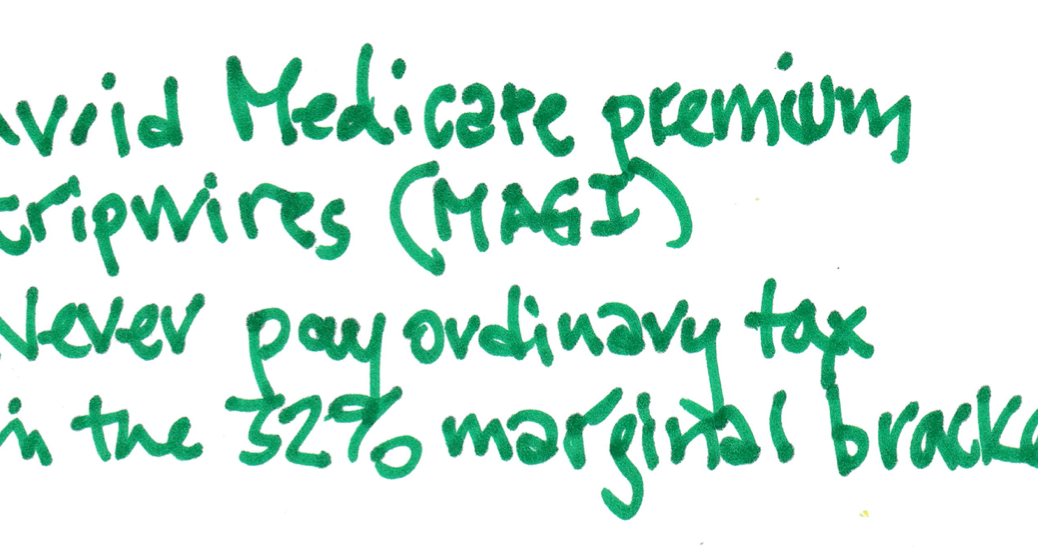
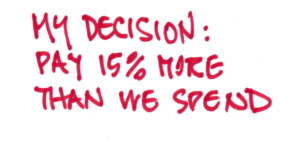
When do we donate the money to charities? I think the decision is clear: donate it now or over several years; Patti and I decided we’d donate the amount over the next three to five years. I see no logic that says you should hold onto this money until death. If you defer these donations, your RMD could grow to the point where you cross income tripwires that result in greater Medicare premiums – the amount deducted from your gross Social Security benefit. That’s not smart.


Always use QCD directly from your Traditional IRAs. You always get the full benefit of tax deductibility of donations, and you avoid any issues of crossing the tripwires that can cost $1,000 or more.


Patti and I spent the time over the last four or five years to pick charities we really like. We focus most of our donations on four. I plan to pay out the allocated MORE THAN ENOUGH over the next three to five years.


How should I invest the portion of the MORE THAN ENOUGH I earmark for charities? I called the four charities. They have their reserves invested, roughly, at 70% stocks and 30% bonds. That’s the way I have invested the money that will flow to them. I don’t have that money sitting in an account identified as “MORE THAN ENOUGH for charities”, so I can’t directly track my percentages, but I will be close. (I could set up an account for that, though.)


== People ==


In general, leaving money in from your traditional IRAs to be disbursed to heirs or others is not the most efficient way to get your money to them. Our wills govern the disbursement of 1) the money in our taxable investment account and 2) the proceeds of the sale of our major non-financial asset, our home. Those are the two best sources of money to leave them because they escape taxes on capital gains. Our will names specific amounts we want to leave to people; the amount adds to a bit less than the net proceeds from the sale of our home. We didn’t include any proceeds from our taxable investment account in that math: again, I don’t view the money in our taxable investment account as something we plan to give them or that we should try to conserve for them.


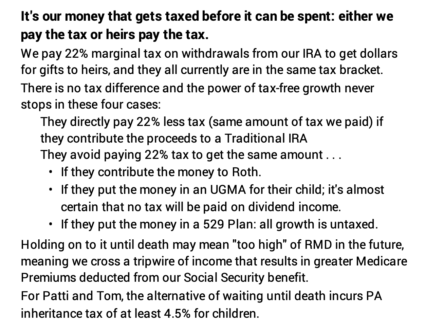
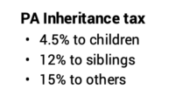
When do we give the money? Patti and I decided to give the MORE THAN ENOUGH allocated to heirs or others while we are alive; we’ll do that over the next five years. It makes no sense to hold on to it. I view that there is no tax penalty by giving it to them now, and, because of the state we live in, Patti and I have a clear tax advantage to give to them now. Our biggest incentive to give now is to avoid Pennsylvania’s inheritance tax.


Even without PA inheritance tax, I see no financial reason to hold on to the MORE THAN ENOUGH for heirs. I see no tax penalty for giving to them now. Our simple assumption is that heirs getting money now will invest the amount we give them to directly be more financially secure. It really makes sense if the money we give them goes from our retirement account to their retirement account, and we’ve encouraged that for all gifts that we’ve made: the tax-free compounding of growth does not stop; it only stops when they sell securities for their spending.


If they spend it, it will be on something that makes them happier now, and we are fine with that. We have NO concerns that they will spend on something that we would judge as irresponsible or frivolous.


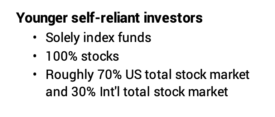
Our heirs will primarily invest the gifts we give now in the same way as we invest because I think we’ve educated them on how to be a successful, self-reliant investor: invest solely index funds; 100% stocks to at least ten years before they retire (and none are close to that mark); and the two types of stock funds that Patti and I hold. It will grow by the exact same rate that it would grow if Patti and I held it.


How should I invest the portion of the MORE THAN ENOUGH I earmark for heirs? I have that invested as 100% stocks, which is the way they would invest it if they had it now. Again, I don’t have this amount in an account identified as “MORE THAN ENOUGH for heirs”. (I could set up an account for that, though.)


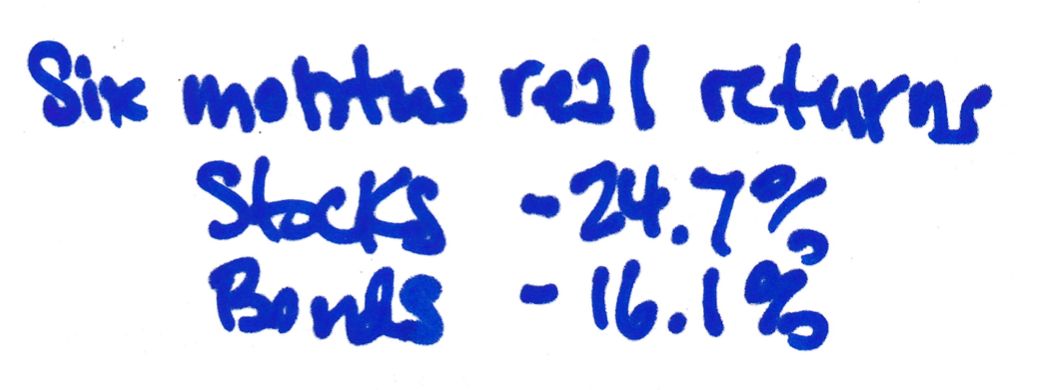
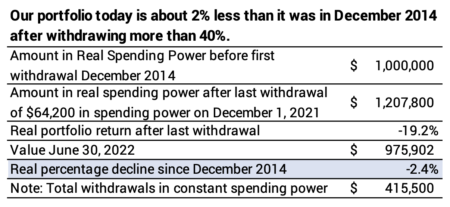
Conclusion: Patti and I are Happy Campers that I describe in Chapter 10, Nest Egg Care. We have MORE THAN ENOUGH portfolio value than we need for our spending since stock returns for our first eight years significantly increased our annual Safe Spending Amount. If you have MORE THAN ENOUGH – or have MORE in the future – you need to decide who gets the MORE: charities or heirs. One has to decide when to give it to them: Patti and I decided to disburse to both over the next three to five years. Over that period, you have to decide how to invest the MORE THAN ENOUGH. The amount for heirs has to be 100% stocks. Patti and I decided we’d invest the amount for charities at 70% stocks and 30% bonds.

How much portfolio value do you need?

How much of portfolio value do you need for your spending for the rest of your life? It takes a number of steps and decisions to get to the answer. I went through two steps the past two weeks, here and here. This post does the math to find the amount of securities you need to sell from your nest egg each year. It then calculates the total financial portfolio you need to support those withdrawals from your nest egg. In the steps I follow, I pile up two cushions in the math steps for Patti and me. The two add to more than 25% more than the accurate math I use in Chapter 10, Nest Egg Care (NEC). I want those added cushions so that Patti and I have NO, NO, NO emotional stress about our financial future. We’re at the age where we should be totally stress free and focusing on enjoying more.


== Background ==


As I stated in the last two posts, Patti and I are in the category of The Happy Campers in Chapter 10, NEC: we have More Than Enough portfolio value to support our desired spending. My last calculation of our Safe Spending Amount (SSA) showed Patti and I can pay ourselves 46% more in real spending power for 2022 than we did in 2015; our real level of spending has not changed; I judge it won’t change much in the future. That 46% increase in our ability to spend stems from 46% greater portfolio value than we need; I’ve annotated our detailed calculation sheet here.


== The steps ==


Here are the steps I go through in this post to calculate an amount of portfolio value that gives me NO DOUBT that Patti and I have enough for our spending for the rest of our lives. I’ve added emotional cushions that mean I calculate about 25% more than I would calculate following the math in Chapter 10, NEC. That 25% emotional cushion gives me far less stress about monthly cash flow, the effect of bad variations of stock returns – like this year, or the worry about one of us living so long that we could possibly deplete our portfolio.


== Herb and Wendy ==


Let’s walk through the steps using an example. This is for a couple, Herb and Wendy.


1. Herb and Wendy find their spending averages $8,300 per month or $100,000 per year. They’re happy with this. They judge that that won’t change much in real spending power for the rest of their lives.


2. Herb adds a 15% buffer to set total “pay” – total cash inflow – to $9,600 per month or $115,000 per year. Like me, he likes the routine of seeing more cash coming in each month than goes out. He likes to carry a high checkbook balance. He’ll deal with the amount that should be left over at the end of the year; that’s a nice problem to have. He finds life is less stressful that way.


3. Herb subtracts their Social Security payments as their sole source of other income for spending. (Patti and I have a small amount of income from a defined benefit retirement plan from years ago that I’d deduct, but I’d lower its spending power since it does not adjust for inflation.) Herb now knows how much – net of taxes – has to come from sales of securities from their portfolio: about $75,000.


4. Herb grosses up the $75,000 for total taxes that he pays. He sorts this out the way I sort it out: I basically withhold all taxes for the year when I take our withdrawal for spending from our Traditional IRAs. I’ve reviewed past tax returns and see that I won’t make a mistake for this exercise if I assume 20% as the percentage to use to gross up total security sales. Herb similarly uses 20%. Herb divides the $75,000 he wants to net by 80% to get gross securities that he needs to sell each year: $94,000. That amount is in constant dollars and will adjust for inflation each year.


5. Herb multiplies the $94,000 by the inverse of the Safe Spending Rate (SSR%, Chapter 2 NEC) that he used on his last calculation date. (He can use that SSR% because all nest eggers stepped up to a new age-appropriate SSR% this past year due to the excellent returns in 2021.)


Herb and Wendy are older and use the same SSR% that Patti and I use 5.05% (Patti was 74 last November 30 with life expectancy of 14 years; see Appendix D, NEC.) The inverse is about 20. (Herb’s building cushions: he could or could not up that by 5% for the Reserve described in Chapter 7, NEC.) Herb uses 21 as his multiplier and  gets a total of ~$2.0 million.


6. Herb arbitrarily adds another ~10% cushion. He multiples the $2.0 million by 1.1 and gets $2.2 million. The sum of all these cushions add to more than 25%. One reason Herb makes it that high is so that he can explain to Wendy that his calculations say they have 25% more than they will ever spend in their lives. DO NOT WORRY. Focus on figuring out how to ENJOY MORE.


7. Herb looks back at his brokerage statements on his last calculation date and finds he had more than $2.2 million. That added amount is invested for someone else: their heirs or charities that are dear to them. I’d think that this could be invested differently than the $2.2 million that’s invested for Herb and Wendy. I discuss this in next week’s post.


Conclusion. In Chapter 10 Nest Egg Care I show the math to calculate how much portfolio you need for a desired spending level. The steps are more detailed. This post is the third in a sequence and calculates 1) how much of your monthly or annual “pay” – that’s the cash inflow to our checking account for Patti and me – must come from sales of securities from your nest egg; and 2) how that total translates to the portfolio value you KNOW is enough for your spending for the rest of your life (or lives). I personally add more than a 25% cushion to the calculations. Patti and I had that amount (and more) on our last calculation date, November 30. The message to our brains is clear: DO NOT WORRY. You can’t run out of money. Focus instead on figuring out how to ENJOY MORE. NOW.

How much should you pay yourself from your nest egg?

Last week I described that Patti and I fall in the category of having More Than Enough that I describe in Chapter 10 of Nest Egg Care (NEC). Our current portfolio value supports a Safe Spending Amount (SSA; Chapter 2) that means our total pay is greater than our actual spending. Our planning focus is different than when we started our financial retirement plan: I can work from what we spend (described last week) to what we should pay ourselves (this week) to how much portfolio we need to have (next week). The purpose of this post is to give you my thoughts on that second step: how much we should pay ourselves from our next egg relative to our spending? I settle on total pay that is about 15% more than our spending.


Total pay for Patti and me equals the after-tax proceeds of Social Security benefits and other pension income + the after-tax proceeds from the sales of securities from our nest egg that I distribute each month into our checking account.


Even with the steep decline in our portfolio so far this year, Patti and I – and you most likely – remain in the category of having More Than Enough: for example, Patti and I have almost the same amount we had in December 2014. If you started you retirement plan and withdrawals later than we did, you have more now than in December 2014. (The historical data for this display is from the spreadsheet you can download in this blog.)


== Sloppy checkbook: $10,000 minimum balance ==


I wrote in this blog that I like to keep a sloppy checkbook. I want to have healthy checkbook balance. I formally decided this week that I want to target a minimum balance of $10,000, an amount that many would judge as too much.


I learned my lesson this year. I used some of the cash balance in our checking account to buy a $10,000 I-bond in May; the rest of the cash came from advanced pay from the cash I have set aside for our total pay for 2022 in our Fidelity investment account.


I found the effort to maintain a low cash balance was a hassle. I checking on our checking balance too often to make sure we’d have enough to fully pay our credit card statement that is debited on the 22nd of each month. I hate thinking I need to carry that thought around in my head. That is a tiny bit of stress I do not need. It’s much better for me if I keep a high checkbook balance.


I estimate that I might be giving up 6% annual return on the excess that others might be able to keep. (+6% is the expected real return rate for our mix of stocks and bonds.) That might mean I’m forgoing $40 or $50 per month in added return so I can avoid the hassle of thinking about not having enough to pay all our bills. That’s worth it to me.


== Total pay: 15% more than we spend ==


Does the 12-month total for spending I found last week really represent typical spending? I remembered that Patti used frequent flyer miles for our airline tickets for our upcoming trip to England in August. I adjusted the 12-month total to include the price of those tickets. We don’t have many miles left and we won’t be earning more any since I switched our credit card to 2% cash back.


I decided to pay ourselves 15% more than our average monthly spending. I think the lowest I would go is 10% more, so 15% is more on the sloppy – too much – side, but I’m happy with that.


My friend Steve does not pay a regular monthly amount from his nest egg. He is proud to say, “I only sell when I need money.” He’s passionate about keeping a bigger percentage of his total portfolio invested. I would not like that approach. I think it is constraining. I don’t think he and his wife spend their annual Safe Spending Amount. I don’t want to have to have a discussion with Patti on whether or not we can afford taking a trip and go through the anguish of judging whether or not it is a good time to sell – as in now, for example.


I like selling once in the year (the first week of December) and paying the total out monthly. I like the subtle pressure to think about enjoying and spending more. If Patti suggests we travel to visit our nephew and family in Seattle, I don’t want to hesitate. I want the money sitting in our checking account to pay for it.


The extra I pay means we likely will build an excess in our checking account toward the end of the year; that’s happened in most years. We then have the decision of 1) donating the excess; 2) giving it to heirs; or 3) using it, in effect, to lower spending for the next year; we’d do that by just applying it to next year’s target for spending. We’d sell fewer securities in the first week of December to get the cash we need for our spending in the upcoming year; this third option looks more probable this year than in any other year.


== What we need for 2023 and beyond ==


I now have a very good handle on the total cash I want to have in early December for our spending in 2023. I don’t think our spending pattern is going to change in the future. I’ll just have to adjust the amount for 2023 for inflation in the following years; I’ll similarly adjust the amount of securities we need to sell from our nest egg.


== My remaining task ==


My remaining task is to calculate how much portfolio value we need for the annual gross withdrawal from our nest egg. We’ll have an excess, and we need to decide what to do with it. I describe the basic calculation and options in Chapter 10, NEC, but I’ll discuss more of my thinking next week.


Conclusion: Patti and I fall in the category of having More Than Enough – greater portfolio value than we need for our spending: excellent stock returns are the primary reason. Our calculated Safe Spending Amount added to our Social Security and other income is more than we spend. I can start from what we spend, decide on what to pay ourselves, and then derive how much portfolio value we need and find the amount that is More Than Enough.


Last week I found out how much we spend in a year from our checkbook statement of spending: “Checks & Deductions”. I can then figure out how much I want to pay ourselves in the year. Patti and I are at the age where we DO NOT want to think about not having enough to enjoy. I want to pay ourselves MORE than we spend: I want the subtle pressure to spend to ENJOY MORE. I made two decisions. The minimum balance in our checking account should be $10,000. I decided that our total pay should be 15% more than what we spend.

How much do you spend in a year?

I looked in detail at our spending in this blog about 18 months ago as a way to help me understand how much we needed to pay ourselves from our nest egg. I did the same exercise this week, but in a much simpler way. I just track the “Checks & Deductions” from our checking account to get the total that we spend for the past 12 months. This post describes how I did that.


A snippet from my monthly checkbook statement.


== Why do I want to know? ==


I want to know how much we spend in a year to know how much we need to pay ourselves from our nest egg. Patti and I are really settled in our spending habits. I don’t think our annual spending – measured in constant spending power – is going to change much the rest of our lives. We might have a bigger trip or extra trip in a year, but I think it’s more likely that we reach the point that we don’t travel as much. Once I have a good handle on what we spend now and will spend in a year, I can calculate how much total portfolio we need to have.


I do this exercise, because Patti and I have fallen into the category of having “more than enough.” (See Chapter 5, Nest Egg Care [NEC].) All nest eggers and many of those planning for retirement are in this category: returns have been excellent. We all have more now – even with this downturn – that we thought we would just a few years ago. We all have seen an increase in our Safe Spending Amount (SSA; Chapter 2, NEC.)


Returns for Patti and me since we took our first withdrawal for spending in 2015 have been such that our calculated SSA for 2022  is 46% greater in real spending power than for 2015. (That’s 76% when I add in inflation.) Our spending has not increased in real terms: we aren’t traveling more or more expensively, and travel clearly is our biggest discretionary expense.


If I pay 46% more from our nest egg, it will swamp our spending. It makes less and less sense to pay ourselves our annual SSA. It makes more and more sense to think of taking an amount off the top for significant gifts or donations: we don’t need to die with far, far more than we needed for our spending.


== What we spend: the simple way ==


The simple way to figure out how much Patti and I spend is to look at our monthly checking account statements. I don’t spend from our Fidelity investment account; I only transfer our monthly SSA to our checking. The “Checks & Deductions” on my monthly checkbook statement includes all spending. I made this spreadsheet that you can download and entered the “Checks & Deductions” each month for the last year.


I want to exclude items I don’t consider as spending. Examples: I had an accumulated surplus (pay less spending) that I transferred back to my Fidelity investment account in December. I purchased an I-Bond in May; that hit my June checking account statement; that was an investment debited from our checking account.


I want to calculate the total spent over the last 12 months, but I saw three lumpy months that I wanted to understand before I just accepted the total as accurate.


1. Property taxes hit in my March bank statement. Big. Ugly. I get no joy by using our FUN money for property taxes. I always ask, “Why am I using our FUN MONEY to sink in a non-financial asset that that I’ll never get back in my life time?” I think I should use our HELOC to pay them, but I haven’t yet. Maybe next year!


2. Two credit card payments debited were roughly double the others. The big items are airline fares (At our age we fly business class for long trips.) and trip fees if we prepay all lodging and local transportation on an organized trip (Italy was the example last fall.) I can find those lumps by going on the internet and looking at the credit card statements, but I don’t have to do that since I use Quicken as our checkbook register. I have those items singled out in the detail of our credit card bill.


The lumps will always be there until I bit the bullet on those property taxes. They are part of our spending. But it was helpful to see that the on-going spending – excluding the lumps – is not that variable. That on-going spending is basically flat may be an obvious conclusion, but it was reassuring to see that. I see no pattern of increased on-going spending over this past year, although inflation has to be taking a toll.


This is step one of a process. Next week I’ll discuss the details of my thinking on the next steps.


Conclusion: I want to to understand how much we spend in a year. I think what we spend now won’t change much for the rest of our lives. The easy way for me to figure out how much we spend in a year is to add up “Checks & Deductions” for our last 12 bank statements. I can eliminate items that really aren’t spending. I can look for any unusual items in the months with lumps of added spending. In our case they are just lumps; we’ll incur similar lumps in the future. I found that our monthly spending, excluding the lumpy items, does not vary much at all. Maybe that’s an obvious conclusion, but it was reassuring to see that.


Understanding what you spend is key to understanding what you should pay yourself from your nest egg. And then you get to how much you really need in total portfolio value. I’ll get to my thinking on those steps next week.

When will this bear market end?

I have no idea of when this bear market will end. I have no crystal ball. But I was not remembering what has to happen for it to officially end. The purpose of this post is to describe that event.


We can only have a bull market or a bear market. There is nothing in between. The S&P 500 – the index that tracks the market value of the top 500 stocks – became a bear market because the index dropped 20% below its previous peak. The S&P 500 index closed at 4,796.56 on January 3. It closed this past Monday at 3,749.63. That’s more than a 20% decline.


The S&P 500 will become a bull market when it closes on a day when it has increased 20% above its previous low point.


== We won’t be whole ==


That will mean we will be in a bull market before we get back to the peak on January 3. I think you remember the math: it takes a greater percentage increase to gain back the percentage decline. If you had a $100 and it declined by 20% or $20 to $80, you need a 25% increase to grow by $20 to get back to $100. The steeper the percentage decline, the greater the percentage increase you need to get back whole.


If the decline from the peak was 20% to be then be an official bear market and then immediately improved 20% to then be an official bull market, you’d still be 4% below the peak.


And we know that the decline as of yesterday is greater, so a 20% increase from that point leaves you 8% below the peak.


== Thinking real ==


The usual math ignores inflation. We nest eggers always try to think real. We track our portfolio value and return rates by eliminating the distortion of inflation. We’ve had almost 5% inflation since December, so we’ve really had nearly -27% real decline in the S&P 500 portion of our stock portfolio as of yesterday. Ouch. It’s a big lift to get back.


It may take more time to reach the low point. It will take time to see a nominal 20% increase from that low to then be a bull market. Each month inflation will nibble at the the spending power of our portfolio. We’ll really have a greater distance – more time – to go truly reach a bull market and to truly get back to the January 3 level.


== I ignore the Jan 3 peak ==


Our brains always focus about the change from the peak, but January 3 is not the peak that concerns me. I’m concerned about 12-month real returns and real portfolio value on November 30, the date I use to see if our Safe Spending Amount (SSA; see Chapter 2, Nest Egg Care) will only adjust for inflation or if it will increase in real terms. My peak is 3% below the January 3 peak. I don’t have to come back quite as far, but it is still a distance. It looks now as if I won’t calculate to a real increase in our Safe Spending Amount for 2023, but that’s Okay. Patti and I are more than fine with what we pay ourselves now.


Conclusion. We entered a bear market this week. The market is 20% below a prior peak on January 3 this year. We can only be in a bear market or a bull market. We get back to a bull market when the market closes at 20% above its prior low point. Even if the market turns on a dime now, a 20% increase and the declaration of a bull market doesn’t get us back to the prior peak. The math tells us we need a greater percentage increase to gain back the decline.


The descriptors of bear and bull markets ignore inflation. Month by month inflation is nibbling away at our portfolio value. The portion of our portfolio represented by the S&P 500 really declined by 20% before this past Monday. When they announce we’re back to a bull market, it won’t really be a 20% increase from the prior low.