All posts by Tom Canfield

Did you match our returns for this year?

I’m throwing down the gauntlet. In past years I might have said, “Ha! Beat That!”, but not now. When we’re retired, our challenge is to keep as much as we can of what the market gives. My challenge to you is to compare to see how close you came to returns that Patti and I earned for our stocks and for our bonds this year. If you are close, you squeezed out and kept what you should have. If you are a couple of percentage points off, I’d argue that something’s not right with your portfolio. The purpose of this post is to describe our returns. I hope your returns are VERY CLOSE to ours.


== How I calculate our returns ==


I get the return data for each security we own from Morningstar. Click on the Performance tab for each security. The site updates 12-month, time-weighted returns overnight. I’m compulsive and look to get returns for the year the morning after the last trading day of the year. That was December 31 this year. You don’t have to be as compulsive as I am: Morningstar updated the table of historical annual returns on the Performance page after the first trading day of the year – that was the morning of Jan 3 – to clearly show calendar 2019 returns.


When you only hold four securities like we do and have picked your weights for US vs. International, the calculations to get to totals for stocks and bonds are a snap. Shame on you if you have more clutter – a lot of funds, ETFs and individual securities that you then have to weight correctly to get to your total return for your stocks and your bonds: your task can be painful. Most folks have far more clutter than just four funds/ETFs and just don’t do this calculation. I’ve not seen brokerage statements that help a whole lot with this task. Those folks will conclude that they had a good year in 2019 but they will have no idea how they did relative to what they could have earned from a very simple portfolio.


== Stocks +28%. Bonds 9%. Overall for us +25% ==


The table below shows the return for each of our securities and my calculation of the total for stocks and bonds for the weights (US vs. International) that I picked and for our portfolio total given the mix (Stocks vs. Bonds) that I picked. (See Chapters 8 and 11, Nest Egg Care (NEC)). Nominal returns for our stocks were up 28.2%. Bonds were up 9.1%. I think my decision on weights results in good benchmarks that you can use for comparison. The total for our mix of Stocks and Bonds was 25.3%.


The table below shows that 2019 was clearly our peak year in the last five for our stocks and for our bonds and for our overall total.


== Our real return has averaged 7.4% per year ==


I’m much more interested in real return rates. Inflation just confuses me. Real returns drive real increases in our Safe Spending Amount (SSA). (See Chapters 2 and 6, NEC.) Our real return rate for our portfolio for 2019 was 23.3%. Our average annual return for the last five calendar years is 7.4%. Obviously, the return this year boosted that annual average: at the end of 2018 the four-year average was just 3.7%. The 7.4% is greater than our expected return rate – using the long-term returns for stocks and for bonds – of 6.4%.


== Your return will vary with choice of mix =


I recommend a range of mixes of stocks and bonds in Chapter 8, NEC. Patti and I are at 85%-15%. My friend Steve doesn’t have his eyeballs focused on a distant future year and is more worried about annual ups and downs than I am. He’s more comfortable with 75%-25%. Our 85%-15% mix is about 1.8 percentage points greater real return than Steve’s this year (23.3% – 21.5%).


Our cumulative return over five years is about 10% greater than Steve’s. That’s meaningful. That means that Patti and I would now have about 10% greater annual SSA than Steve and his wife, all other things being equal.


== Your choice of securities may be different ==


You may have chosen different mutual funds/ETFs than I did. My friend Chet and I have the same weights and mix, but Chet picked different securities for US Stocks and International Stocks. We’re the same on bonds. Results for our choices of US stocks are almost identical over the last three years, but Chet’s choice for International Stocks is about .1 percentage point greater average annual return (10.02% – 9.91%).


When I add in the return for bonds Chet is running .01 percentage points ahead on the annual return rate for our portfolios (11.96% – 11.95%). If we both started three years ago with $100,000, Chet is now $42 ahead.


Conclusion: Calendar year 2019 was a terrific year for both stock and bond returns. Patti and I earned 28.2% for our stocks and 9.1% for our bonds. Those returns are good benchmarks for you to compare to your returns. You should be VERY CLOSE to those for stocks and for bonds. If not, something is amiss with your portfolio.

What will you do in 2020 with your pay raise?

All of us Nest Eggers will calculate to a real pay raise for 2020: that’s because of the excellent stock and bond returns this year. (I describe our pay increase for 2020 here and the prospects for another real increase for 2021 here.) In the old days, I’d likely plan on saving more from a real pay increase but that makes no sense now: we have to spend or gift more from pay increases now. Saving makes no sense. This post describes my thoughts on what we’ll do with ours in 2020: I’m focusing on lowering stress and buying more enjoyable time. Have you sorted out what you’ll do with your pay raise?


As I look back on prior posts, I laid out my thinking of “What’s Money For” in a series of posts last March and one in July. (See here, here, here, here, and here.)We should think of using our money for BFFC: the Basics – which don’t really change much over time; Fun – fun experiences almost solely from travel and spending for less stress for Patti and me; Family ­– our money can help them enjoy now and be more successful in the future; and Community – Patti and I try focus our giving to reduce human suffering (see here).


== Small $$$ signal, but it’s enough to think about ==


Our pay raise for our spending in 2020 is not large. It’s just a 2% real increase over 2021. On top of the 1.6% inflation rate, that means our paychecks – the monthly amount we pay ourselves from our Fidelity account – will increase by 3.6%.


We clearly have the all BFFC options, but I want to focus on spending that small increase for 2020 to lower stress and give us more free time. The article I cited before “One surprising way money can buy happiness, according to scientists” states, “People who buy time by paying someone to complete household tasks are most satisfied with life . . . yet very few individuals think to spend money in this way.” And I just finished this book, “Happy Money, The Science of Happier Spending”. It similarly says, “Most individuals fail to use their money to buy themselves happier time.” The question we should ask is, “How will our spending change the way we use our time?” When we focus on our time rather than our money, we act like scientists of happiness, choosing activities that promote our well-being.


== We spend to enjoy ==


Patti and I already do a pretty good job of freeing up time and avoiding tasks we never did like or no longer like:


 • We pay for help around the house. Most of these tasks have migrated from somewhat enjoyable many years ago, but now fall in the unenjoyable category. Cindy helps clean inside. (That was never enjoyable for either one of us!) Doc routinely cuts the lawn and does the minor outside work; RJ does a great job on planting the annual flowers; Joe and his crew do the major cleanups and trimming; Kapps does their thing to keep the grass green. Steven does the windows and the leaves on the roof in the fall. (I stopped climbing ladders ten years ago.)


• I cook a complete meal from scratch only about twice a week — but we don’t eat out that much either. Our local Food Shoppe is 1/3 mile away. We find that picking up one of their two-person meals for $12 – and we’ll have leftovers – complemented by our vegetables and even naan bread saves us a lot of time. Plus, the food is really good. We also have lots of other carryout places for diversity within ½ mile. Our current favorite is Aladdin’s.


• I “outsource” our bill paying. I’ve automated our payment of routine bills (utilities, phone, internet, credit cards, mortgage) through PNC BillPay. I rarely hand write checks. Setting this all up took time, but now it’s stress free. I think I’ve handwritten and mailed fewer than ten checks this year.


• We don’t drive long distances. I think our max driving time is six hours. More than that is not enjoyable to us. It’s much more relaxing for us to fly and rent a car if needed. Patti plans way ahead and always gets low fares and rentals. It’s often cheaper to fly and rent a car than it is to drive.


== We can do better ==


Here are things that have been unnecessarily stressful for us this last year. We can buy lower stress.


• Get help for winter snow removal. I used to like to do this, but I no longer want to get the snowblower out to keep the walks and drive areas clean. Doc said he’d do this for me this winter. He’ll make the call when there is enough snow. I’ll keep my mouth shut if he come when it’s iffy on the amount of snow or if the weather forecast says it will melt later on.


• Get help with the Christmas decorations. Our house looks great when we get the decorations up, but we don’t consistently get them up. It’s become a bit of a chore. That’s partly due to my poor organization of what to buy, when to buy it, and where to buy it. I have this all down now in my 2Do app for next year. should be a snap. We also need help getting the Christmas tree from the basement up to the landing on the second floor. It’s an awkward task and really not 100% safe for Patti and me to do this by ourselves. We had Doc and his wife Barb help this year. That was great. After Christmas I’ll have them come back to help put it away. They’re both agreeable to helping next year on the last Sunday in November 2020 – if Doc isn’t deer hunting.


• Get help for Spring and Fall cleanings inside. I don’t really see that much need, but Patti wants our house to be really, really clean inside. She complains at times that it isn’t clean enough. Cindy can come extra, and Doc and his wife Barb can help. I put down to schedule two special clean ups: one in April and one in November. Those will make Patti much happier.


• Get the cars detailed every spring. This is not a stress reducer since I spend very little time on keeping our cars clean. We drive so little now that they just don’t get very dirty, and the car wash is just 2 miles away. But they do look great after I get them detailed, and I get a bit more pleasure riding in them. The cleaner they are the less I’m inclined to think about buying a new car. I have not had them detailed on any regular schedule. I added reminders in 2Do to call for appointments in the last week of March for early April.


Conclusion: All Nest Eggers will have a real increase in their Safe Spending Amount for 2020. We all need to think what we’ll do with the extra pay. We certainly know we have no need to save any of it. This year I thought more about spending on a few things around the house that would reduce stress or add a bit of pleasure: bye-bye to winter snow removal; get the Christmas decorations up painlessly; power clean the inside of the house twice a year; get our cars detailed each spring.

How have you isolated yourself from bad volatility in your portfolio?

Our portfolio – your portfolio – shouldn’t be viewed as one big pile of money. For almost all days in the year I can’t help but look at our total as one big pile: I see the total amount Patti and I have on the portfolio page after I log in at Fidelity. But I really don’t want to think about it as one big pile or just two piles of stocks and of bonds. I want to think about it as three portfolios grouped in different holding periods – the number of years on average that we’ll hold stocks and bonds before we sell them for our spending. Each portfolio has a different mix of stocks and bonds and therefore different expected return and volatility: low, medium and high on both counts. The purpose of this post is 1) to look at the past five years of return rates and volatility in three re-imagined sub-portfolios for our Investment Portfolio and 2) to remind ourselves how we further isolate ourselves from bad volatility of returns.


== My analogy of bottling wine ==


I can easily recast our stock and bond returns into three groupings, but I imagine this task differently. I want to have a physical image of our portfolio arranged into holding periods. I’ve settled on the analogy that our portfolio is wine and that every December 15 I bottle very properly aged wine to consume in the upcoming calendar year. That is what I do: I sold securities this month equal to our Safe Spending Amount (SSA) for 2020; after withholding taxes, I’ll pay out the net from our Fidelity account to our checking account each month. Patti and I receive a case of wine each month to consume.


I imagine that Patti and I have three groupings for our wine: two groups of wine barrels that I imagine we keep in our garage. Each barrel holds one year of wine that I will bottle in December and consume in the next year. One large vat is out back and holds the rest of our wine. Last Sunday, December 15, I imagined I went out to the garage to bottle the wine in the barrel for our 2020 spending. (You can read more detail of how I spent two prior imagined “Bottling Days” here and here.) That barrel was in the #1 position of the ten barrels. Here’s the listing of the barrels and detail information that I’ve marked on each.


I group the first three as Finishing Barrels: each is 80% bonds and 20% stocks. I group the next seven as Aging Barrels: each is 60% stocks and 40% bonds. All the rest – it will be more than ten years before we bottle and drink any of that – is in a Large Vat and is 100% stocks.


I like to think how long wine that we drink has aged and the care we’ve taken to age it properly. The wine that we will drink for 2020 was first filled with wine from the Large Vat in 2009. Some of that wine had been in the vat for 30 years. That barrel then aged for seven years at 60% stocks and 40% bonds and then three years at 80% bonds and 20% stocks. That’s quite a process.


At the end of my work day, the lineup of barrels looks the same as it was at the start of the day, but I’ve rolled the 2021 barrel to the #1 position. I moved the empty 2020 barrel to the back of the line in the #10 position. I filled it from the vat. I adjusted the mix to 60%-40% and marked “Bottle in Dec-29 to drink in 2030” on it. I also adjusted barrel #3 to be 80% bonds and 20% stocks rather than 60% stocks and 40% bonds.


== The pattern of returns and volatility ==


Do the the mixes of stocks and bonds in my three groupings make sense? (You can see the detail calculations that lead to the two summary tables here. I’m using our 12-month returns ending November 30 for this table.) The three groups follow the expected pattern of returns that I would expect. Finishing Barrels are about 2.3 percentage points less in annual return than Aging Barrels. Aging Barrels are about 2.3 percentage points less in annual return than the Large Vat.


The three have generally followed the pattern of lower to higher volatility that I would expect. My crude measure of volatility is the percentage point difference between best to worst annual return.


A few of the details surprise me. I would not expect to find that a finishing barrel had the largest negative return over five years; that’s the -3.2% in 2018. I would have expected the 13-point spread for Finishing Barrels to be MUCH LESS than that of the other two; that large point spread is due to the high return for bonds this year, and that’s a good thing.


== We want further isolation from volatility ==


None of these five years come close to a Most Horrible year. Oh, Patti and I are really happy about that. You should be, too. 1974 was the worst or close to the worst year in history. We’re looking at a -12% real return with a mix of 80% bonds! And those others! That was ugly.


When I think that a year like that is possible, I always think about the off-the-top Reserve that Patti and I exclude from our calculation for our Investment Portfolio. (See Chapters 1 and 7, NEC.) I will use the Reserve for our spending in a year and completely dodge having to sell securities in a year that is remotely close to 1974. When I use the Reserve rather than selling stocks when they’ve cratered, I’m buying time for our Investment Portfolio to recover.


Patti insisted on two years of spending in Reserve. (See The Patti &Tom File at the end of Part II, Nest Egg Care (NEC). That means right now we can wait three years before we would have to sell stocks: spending for 2020 is in cash/near cash; we could use the Reserve for spending in 2021 and 2022. The first date I might have to sell stocks is December 2022. And I can stretch that date: I likely would see poor returns well before our caclculation date at the end of November and we could easily lower spending – that’s fairly painless for us given our real 22% the pay raise over the past five years. And I am now renewing our HELOC (Home Equity Line of Credit) that I could tap to wait longer. That ability to hold off for more than three years gives me the sense that we’ve really isolated ourselves from bad stock market volatility.


Conclusion. We Nest Eggers shouldn’t view our portfolio as one big lump that rises and falls with market returns. That tends to make us too sensitive and too emotional when we are hit with bad volatility in stock returns.


It helps to imagine our portfolio in parts related to different holding periods. It’s hard to display your holdings in your brokerage account that way. But that’s easy to do on a spreadsheet when you separately track your stock and bond returns. Each holding period should have an appropriate mix of stocks and bonds. I like my arrangement of three holding periods that start with 80% bonds and 20% stocks and end with 100% stocks.


The money invested for the shortest holding period will have lower but more stable returns. The money invested for the longest holding period will have higher but more variable returns; we know that if we’re hit (or when we’re hit!) with bad volatility of stock returns, we have many years to recover.


What return on your nest egg do you need to get a pay increase in 2021?

Last week Patti and I calculated that we earned a small, real increase in our Safe Spending Amount (SSA) for 2020. I can now calculate that a 1% real return on our portfolio over this next year will result in another real increase in our SSA for 2021. Wow! A real pay increase with just 1% return on our portfolio. Sounds impossible. The purpose of this post is to show how I get to that 1% return rate. You’ll understand why it is so low. You will know how to quickly find the return on your portfolio that will give you a real pay increase for 2021.


== The quick math ==


The quick math that told me 1% real portfolio return would give us a real pay increase in our SSA for 2021 is the following: 1) I calculate the percentage return that earns back what we withdrew for spending for 2020: 1/(1-4.85%) – 1 = 5.1%. 2) I calculate how much of that we get from the increase in our applicable Safe Spending Rate (SSR%) from next year to this: (5.05% – 4.85%)/4.85% = 4.1%. 3) I subtract the two to get the real return needed: 5.1% – 4.1% = 1.0%. Read on for more detail.


== Two factors work together ==


As I mentioned in this post, two factors work together to determine whether or not we nest eggers calculate to a greater real SSA – an increase beyond the normal one for inflation: 1) the real return rate on our portfolio and 2) the increase in our Safe Spending Rate (SSR%) applicable to our age.


To understand how these two factors work together, we have to think what’s happening in terms of real spending power: inflation will just confuse us. All dollars and return rates in this post are stated in terms of constant spending power.  


The word “pay” that I use in this post is the amount Patti and I can spend after withholding all taxes – the after-tax amount from our gross SSA. I assume the total percentage taxes Patti and I pay does not change from this year to next. That means an increase in our total SSA also results in the same percentage increase in our pay.


If there is no change in our SSR%, Patti and I will calculate to an increase in our Safe Spending Amount (SSA) when we earn back more than the percentage we withdrew for our spending.


Example: Because of the high returns this year, Patti and I – like you – calculated to a new, higher SSA using the SSR% applicable to this year. In effect, we start on a new plan with a new beginning Investment Portfolio value, new SSR%, and multiplier (what we have relative to a base of $1 million). (See Chapters 1 and 9, NEC.) For this post, let’s use assume the starting value of our Investment Portfolio is $1 million and that we withdrew 4.85% SSR% = $48,500. That left $951,500 after the withdrawal. We earn back the $48,500 – the 4.85% – with 5.1% real return on the $951,500 portfolio.


When our return is more than 5.1%, we’ll have more than $1 million on November 30 next year. The same 4.85% SSR% will calculate to more than the current $48,500 SSA – a real increase in our pay.


If we have 0% return on our portfolio in the year, Patti and I will calculate to the same $48,500 SSA if our SSR% increases to 5.1%; this also works out to be a 5.1% increase in our SSR% percentage. Our SSR% increases in most – but not all – years, and it increases at a faster rate when we are older. This is similar to the way RMD works: RMD increases each year and it increases at a faster rate as we get older.


Example: we had $951,500 after our withdrawal last week. If our return is 0% for the year ending November 30, 2020, we will have the same $951,500. If our SSR% applicable to Patti’s age increases to 5.1% we would calculate to the same $48,500 SSA.


Conclusion: to calculate to a real increase in our Safe Spending Amount (SSA) next year, the Return Rate on our Investment Portfolio AND the percentage increase in our SSR% COMBINED must beat the percentage return that we would need to earn back the amount we withdrew from our portfolio. For Patti and me – withdrawing 4.85% – the combination of the two factors would need to beat 5.1%. If, for example, you withdrew 4.4% as your SSR% in 2020, you’d need to beat 4.6% in the upcoming year.


== Two ways to find the real return you need ==


1. I can use our calculation sheet to find the real return over this next year that calculates to a pay increase for 2021. (You should have your own spreadsheet similar to the one I show in Appendix H of NEC; you can download a template from the Resources tab of this web site.)


I annotated our calculation sheet here so you can see how I found that we need 1% real return for a real pay increase in 2021. I had to enter numbers in two cells: 1) I set inflation to 0%. 2) Then I iterated to find the real return rate that will exceed our 2020 $57,500 SSA: that was 4.85% of our portfolio value before that withdrawal. My iteration shows that .95% return first calculates to a real pay increase. Let’s just call that 1%.


(You can see an annotation on the sheet: if we earn the expected 6.4% real return on our portfolio for the 12 months ending November 30, 2020, we get a 5.4% real increase in our SSA.)


2. I can use straightforward math and not the spreadsheet. The math is simpler this year because we all start out, in effect, on a new plan: it’s a one-year calculation. As I mentioned in the same post above, the math to calculate to a real pay increase after a year – or more – of poor returns is conceptually the same, but it’s a bit more tedious to work out.


Patti and I withdrew 4.85% from our Investment Portfolio for our 2020 spending. The combination of real return rate and the percentage increase in our SSR% must yield more than 5.10%. We know our SSR% will increase next year from 4.85% to 5.05%. That’s a 4.10% increase; we get roughly 80% of the way to the 5.10% we are looking for:


Now we have to calculate the real return rate gets us to the total of 5.10%.  We solve the unknown in the equation below and find that is .94%. This agrees with the number we found by using the spreadsheet: we need more than .94% to calculate to a real increase.


== Use really quick math ==


You can quickly estimate the real return rate you need for a real increase in your SSA next year. You need three simple calculations to get close enough: 1) calculate the percent you would need to earn back if your SSR% did not change; 2) calculate the increase in your SSR% over the year; 3) subtract the two. You’ll be close enough.


For Patti and me the simple steps would have been 1) 1/.9515 = 5.1%. 2) (5.05%-4.85%)/4.85% = 4.1%. 3) 5.1% – 4.1% = 1% real return needed for a real pay increase in 2021.


== Implications ==


Older retirees – generally those in their mid 70s – have a good chance of calculating to real pay increases even when portfolio returns are well below average. I did not think that would be the case. We’re taking out more when we are older because our SSR% is higher; I thought we would need a much greater return rate to justify increases in our SSA. I was not figuring in the effect of increasing SSR%: we older retirees get lots of help from the increasing SSR% applicable to our age. The graph 2-7 in NEC shows that SSR% starts to accelerate when our life expectancy is roughly 15 or so years. That’s going to be when we are in our early 70s.


Younger retirees in their early to mid 60s use a lower SSR% to calculate their SSA; they withdraw less for their SSA. The percentage they need to “get back” is less than for older retirees. But they aren’t getting much help from increases in their SSR%. They need greater real return rates to calculate to a real increase in SSA.


Conclusion: After we’ve calculated our Safe Spending Amount (SSA) for the upcoming year we can calculate the real return over the next 12 months that will result in a real increase in our SSA the following year. In most years real return needed is less than than the percentage you withdraw for your SSA. That’s because you are getting help from the fact that the Safe Spending Rate (SSR%) applicable to your age is increasing. The increase in SSR% for Patti and me over the next year is more than it has been in any other prior year. As a result, we only need a 1% real return on our portfolio for the 12 months ending November 30, 2020 to result is a real pay increase in 2021. This gives me a real sense of optimism.

Did you calculate to a pay increase for 2020?

Did you calculate to a real pay increase for 2020? You should have! The returns have been that good this year. In this earlier post, I thought we were close to a real pay increase: the November stock returns of +2.5% put us over the top. This marks the third real increase in our annual Safe Spending Amount (SSA) in five years. (See Chapters 2 and 9, Nest Egg Care.) Our SSA is +22% from our start in 2015. I now know we absolutely CANNOT deplete our portfolio. We were happy with our initial SSA, and we now have lots of room to painlessly lower our spending rate to prevent that. The purpose of this post is to show and describe the highlights of our calculation for 2020.


== Real 12.3% growth in our portfolio ==


The real increase in our SSA is driven by two factors. The most important factor is the real growth in our portfolio. That was +12% return after adjusting 14% nominal return for inflation. The second contributor is the increased Safe Spending Rate (SSR%) that Patti and I can now use. The SSR% applicable to our age is a slight increase from last year: we, unfortunately, are one year closer to the end of the trail. 


I’ve summarized key data from our calculation sheet here. Our SSA for 2020 is $57,500 as compared to $44,000 for 2015. You can print the full sheet here.


== Details of this year and last five ==


For this year, stocks returned a real 12.9% and bonds returned 8.8%. Both were well above their expected, real return rates: 7.1% for stocks and 2.3% for bonds.


We retirees – and all investors – have tracked a sequence of returns that is better than expected since Patti and I started our plan in December 2014. The real expected return for our portfolio is about 6.4% per year – that’s based on our weights of US vs. International and our mix of stocks and bonds – and our real portfolio return has been been about .7% greater. As I mention in this post we are well ahead of our expected SSA.


== We have more now than five years ago ==


My calculation sheet tracks the real spending power of our portfolio and of withdrawals over time. The base starting point on my sheet is $1.0 million Investment Portfolio. On that basis, Patti and I withdrew $243,000 in real spending power in the first five years of our plan, and our portfolio value right before our withdrawal this year was $1.1 million. Even after the withdrawal this year for 2020 spending, we still have more than we started with. How good is that?!


You’ve had this same experience if you followed the advice as to how to invest in NEC: your spending (and gifting) has marched sharply higher, and your portfolio value is more than when you started your plan.


== We start anew assuming the worst ==


When we recalculate to a new, higher real SSA, we step up to a higher Safe Spending Rate (SSR%). We’re actually are starting a completely new plan. I could throw away my prior calculation sheet and start a new one. (See Chapter 9, NEC.) That sheet would start with the appropriate SSR%; I’d base the start as $1 million initial Investment Portfolio; and I’d calculate a new multiplier (See Chapter 1, NEC.)


When we step up to a higher SSR% for our age, we still assume we will face the Most Horrible Sequence of returns in history. That’s the one I describe here and here. It’s HORRIBLE!


Conclusion: Patti and I ­– and you almost certainly – calculate to a real increase in our Safe Spending Amount for 2020. The increase is small this year, but our cumulative, real increase in our annual Safe Spending Amount is now +22% relative to the start of our plan for the 2015 spending-year. We calculate an increase primarily because our portfolio return was excellent this year – 12.3% real return. Over the past five years, the real return on our portfolio has averaged nearly 8% per year. This is well above the expected return rate for our portfolio of about 6.4% per year. You’ve had the same experience if you follow the investing advice in Nest Egg Care.

Are you giving money to your kids and grandkids this year?

I think many retirees hang on, hang on, and hang on to their nest egg waiting for their heirs to get their money after they are dead. They keep thinking about the step-up in value on death that avoids capital gains taxes. This makes very little sense to me. Give your money now. 1) Maybe your heirs really need the money now. 2) If they spend it now I’d bet they will enjoy it with their families a lot more now than later. 3) They can invest your gift and they will have MORE in the future than if you keep it until you die. The purpose of this post is to describe that latter point: if you give now and your heirs invest it correctly, they will net more in the long run.


Giving now is an easy decision for Patti and me. We have no distracting thoughts about gifts and added taxes: we’ve already paid taxes on the money we know will be left over to gift from our 2019 Safe Spending Amount (SSA; see Chapter 2, Nest Egg Care). That’s because we had our SSA for 2019 in cash at the end of last December. We paid the taxes to get that cash on our 2018 return. We know we can gift with no further tax consequences.


Many folks think differently. They equate giving money to their kids and grandkids with having to sell securities and then paying capital gains taxes. It bugs them to think they would pay capital gains tax now as compared to totally avoiding any tax when the kids inherit the securities when they die. Estates escape capital gains taxes. Heirs get the full market value at death. If that is the way you think about it, you want to answer two questions:


1) If you sell a security and give the proceeds now, can your kids or grandkids ever have more than the alternative of your keeping the security until you die? [Spoiler alert: Yes.]


2) If so when will they have more? [Spoiler alert: ~10 years, but I say far fewer than 10.]


== Give more by giving now ==


We need an example and a spreadsheet that compares two options: keep it until you die or give it now.


Example: You now have a security worth $6,000. This is a mutual fund, stock ETF, or a stock. This investment will earn the expected, real 7.1% per year for stocks in the future. You have low investing costs of .1%; your real return is 7.0% per year. Your 7.0% is the combination of 1.6% dividend rate and +5.3% price appreciation that work together for the 7.0%.


Other assumptions: 1) you pay 15% federal and 5% state tax on dividends and gains. (A different assumption on state taxes does not change the conclusion in the comparison.) I ignore that some investments – mutual funds – have gains distributions in most years that would add to taxes paid; that lowers the net amount invested at the start of each year. I ignore any state inheritance tax. (In my state, Pennsylvania, that’s 4.5% tax for gifts to children and grandchildren; that alone shouts, “Give Now”. 2) Your cost basis is 70% of current value: $4,200. (The higher your cost basis, the greater the reason to give it to your heirs now.)


Option #1: hold your investment until you die. Let’s assume that is 10 years from now. Your heirs will then get your security at its market value and will not incur capital gains taxes. The value of the security on your date of death becomes their new cost basis.


I build a spreadsheet. You can see the first few years and the tenth year below. (A PDF of the two options is here.) At the end of 10 years your heirs get $11,064. That’s their new cost basis; like you did, they’ll continue to pay taxes on the growth.


Option #2: you sell your security and gift the net to a child or grandchild. Your taxable gain is 30% of the $6,000. You pay 20% taxes. Your total tax is $360 or 6% of the $6,000. You gift them $5,640.


The smart thing to do is to directly contribute the net proceeds to an account that grows tax-free. You have three options: your child’s or grandchild’s IRA; a 529 plan; and a Health Savings Account (HSAs) – the best of the three options. (Patti and I mailed our gifts directly to retirement accounts in 2017; we did not make similar gifts in 2018.)


I’ll use the example of gifts to a retirement acccount; the result would be identical for a 529 plan. The result for a gift to a retirement account is the same for either Roth or Traditional IRA; both have the same net benefit to them assuming their marginal tax rate now is the same as when they sell the security and withdraw it for spending. (You can see that detail here.) The result is easier to understand, however, if I display Roth IRA as the example. Your child or grandchild invests the net after you’ve paid tax, and it compounds for a decade at the same 7.0% real rate.


I build a spreadsheet. You can see the first few years and the tenth year below. The amount they have trails Option #1 at the start. But at the end of 10 years the value of their IRA is $11,095 – a shade more than Option #1. Nine or ten years is the breakeven point on this decision.


Option #2 continues to outpace Option #1. It still enjoys the power of tax-free growth. By the 15th year the amount for Option #2 is about 4% more than Option #1.


== I view breakeven as less than ten years ==


I view the breakeven as less than ten years because I assign an added value to giving now. The added value is in your kids and grandkids seeing their money compound over the years; ideally this is a motivation for them to save more and invest wisely. The added value is letting your children use other income for spending on their family: a fantastic family vacation; an educational trip for their kids. The added value is having your kids and grandkids thank you now rather than after you are dead.


Conclusion: This is a very good year to consider gifts to your kids and grandkids. I’d guess that most all of us have not fully spent our 2019 Safe Spending Amount (SSA). Market returns this year tell us our portfolio is in great shape. Clearly we have not been riding on a Most Horrible Sequence of returns.


If we have money left over that we’ve already paid tax on, giving gifts now is a slam dunk: your kids and grandkids clearly will be better off with that money now than if you wait for them to get it after you’ve died.


If you have to pay tax on the sale of a security, do so. Pick highest cost shares to sell and gift the net proceeds to their IRA. It may take a few years for the economics to work out, but your kids and grandkids will have more in the future than if you wait for them to get.

What’s your tax plan for 2019?

I finished my tax plan for 2019 this past week. Have you? I’ve written about tax traps – tripwires and breakpoints – in several posts. (Maybe too many! Most recently  here, here, and here.) I combine all the key tripwires and breakpoints on one sheet of paper that makes it easier see what I should do to avoid taxes. I can see where I might mess up or where – if I am smart – I can avoid taxes that I do not have to pay. The purpose of this post is to give you a clearer picture of tripwires and breakpoints and describe my plan for this year.


Summary: I always want to get our Safe Spending Amount (SSA) into cash by the end of the year at lowest tax cost. You do, too, of course. This takes some planning and thought. There are more ways that you are taxed and tripwires that set off increased taxes than you probably understood. With modest planning you can avoid tripwires that could cost you $1,000s. My plan is to actually pay more taxes this year to allow me to pay less in a future year!


I used this one page Excel worksheet to see how close I am to a painful tripwire. I suggest you use this. A tiny thumbnail is below. Disclaimer: I’m no tax professional, but I think my one page sheet is right – or right enough.


== Types of income and taxes ==


Over this year I’ve worked to understand how we are taxed. There was a lot I did not understand.


We have two kinds of income that are taxed differently. We also may cross tripwires based on the on the sum of those two kinds of income + the addition of items not counted as components of those types of income. Wow, that’s confusing. I hope this chart helps clarify all that.


== Tripwires and Breakpoints ==


This post summarizes all the tripwires – exceed a specific amount of income by $1 and you can pay more than $1,200 in tax – twice that for joint, married filers.


My one page sheet also shows three major Breakpoints that I discussed in last week’s post. A breakpoint marks the beginning of a bracket of income with greater marginal tax. Example: the income that is the transition point from the 12% to 22% marginal tax bracket. Marginal tax brackets are a concern because our real RMD will likely double over our lifetime. Some of us could be pushed into a tax bracket we would want to avoid. With planning we can avoid tripwires and ugly breakpoints.


== Tripwires are the worst ==


I HATE the thought of having $1 too much income and crossing a tripwire that could cost Patti and me as much as $2,400. I MUST estimate my income for 2019 and peer into to the future – RMD will likely double – to see if I am close – or will be close – to a dreaded tripwire. We have four kinds of tripwires and I display nine tripwires.


== Two initial SS tripwires ==


The first two tripwires we face set the percentage of Social Security benefits that gets taxed. If you avoid the tripwires, none of your Social Security benefit is taxed. Cross the first tripwire and 50% gets taxed. Cross the next one and 85% is taxed. Those who are retired but do not have to record RMD have flexibility as to where they get their cash for spending. They may be able to avoid crossing these tripwires. I describe the tactics for these folks in this post.


The tripwires are not the same for all taxpayers. You have to calculate your tripwires. Tripwires are determined by the sum of ½ your Social Security benefit plus other income. I describe this calculation the post cited above and here is another source.


My example in the table above shows that you may able to both of these tripwires if your total income is less than $37,000 for a single tax payer and less than $49,000 to for married, joint tax payers.


== Tripwires for Capital Gains taxes  ==


The next tripwire is at bit more income and triggers taxes on Dividends and Long-term Capital gains. The jump is from 0% to 15% tax. This tripwire almost perfectly coincides with the breakpoint between the 12% marginal tax bracket and the 22% marginal tax bracket. If your ordinary taxable income is solidly in the 12% tax bracket, you will not pay tax on Dividends and Long-term Capital Gains.


Most retirees with a substantial nest egg will fall into the 22% tax bracket when they take RMD. Their two biggest components of income, Social Security benefits + RMD, drive them to that point. They’ll pay 15% capital gains tax. I didn’t include another tripwire in the table above: folks in the stratosphere of taxable income – who fall into the top marginal 37% tax bracket – would trigger the 20% rate.


== Tripwires for Medicare premiums ==


Those well into the 22% tax bracket face a different set of tripwires. These are increases in Medicare Part B and D premiums – I call them added taxes – that are deducted from gross Social Security benefits. Older retirees with sizeable retirement accounts will face these tripwires. The amounts that trigger added premiums don’t automatically adjust for inflation; in real terms they hit us at less and less income as the years roll by. It takes and act of Congress to adjust these. As I mentioned in this post RMD will likely double from the amount you initially take at age 70½, meaning more of us might stumble into a tripwire or two in a few years.


== Tripwire for surcharge tax on investment income ==


The final kind of tripwire kicks in a 3.8 percentage point surcharge on investment income: dividends, short- and long-term capital gains, interest, and net rental income. The surcharge is on the part that puts you over the tripwire. A single taxpayer with  $25,000 0f investment income and $180,000 of other income will pay the surcharge on $5,000 of income: that’s the amount over the $200,000 tripwire. In that calculation, the surcharge is a small added cost: 3.8% * $5,000 = $180.


== My tax plan for 2019 ==


I filled out the sheet I cited above and filled out my estimated income for the year. I also increased RMD by 75% to see how it might really look in the future. I conclude the problem is that Patti and I don’t have enough money in the Roth IRA account I opened last year. (I should have opened one even with a little amount years ago.) Roth gives me the ability to get cash for our spending and avoid crossing a costly tripwire. More in Roth and less in Traditional means lower chance that increasing RMD pushes me into a marginal tax bracket that I would hate. I decided on an amount to convert Traditional to Roth that does not result in crossing an expensive tripwire or a breakpoint. I may repeat this next year.


Conclusion: Retirees who have a nest egg are faced two big issues on taxes. Tripwires can trigger $1,200 in added tax per taxpayer with $1 of too much income. RMD may double over our lifetimes and push us well past a breakpoint of a marginal tax that we would want to avoid. Money in Roth IRA gives you flexibility to avoid tripwires and helps to lower future RMD. My 2019 tax plan is to convert some Traditional IRA to Roth. I’m paying more taxes this year, but I’ll come out ahead if I use Roth to avoid a higher tax later.

Your RMD will likely double in your lifetime: is this a concern?

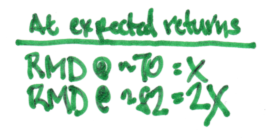
We retirees with Traditional IRA accounts will record increasing taxable income over time. That’s due to RMD, a big component of taxable income for those over age 70½. At expected returns for stocks and bonds, your taxable ordinary income will DOUBLE in real terms over your lifetime. It will more than double if returns are better than expected or if you (ideally) live well beyond your life expectancy. This post explains why your RMD will double and describes what you do if you that would be a concern.


My quick summary: I don’t think this is a big concern. We’ll have more money and more reported income, but very few of us will be pushed into a marginal tax bracket that we would be passionate about avoiding.


I previously posted on this topic and cited how this doubling could push you to a tax bracket that would be painful. But after working through two examples in this post, I think the doubling of RMD is going to be a big concern only for the rarified few who have an UNUSUALLY large IRA. They may face a step-up in marginal tax rate that they would want to avoid by converting big $$$ of Traditional IRA to Roth.


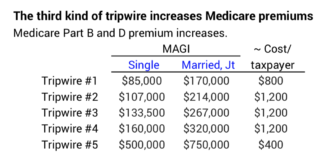
You still may want to convert some Traditional to Roth – I now think it’s more important to have that flexibility to avoid the tripwires of income that result in higher Medicare premiums – but it’s just not that big of an advantage for ordinary taxes. Let’s review and refresh on this.


== The benefit of converting Traditional to Roth ==


You accomplish two things when you convert $$$ Traditional IRA to Roth. 1) You are lowering the amount subject to future RMD. 2) You have locked in the current tax rate that you pay when you convert; you are ahead of the game when you withdraw from Roth for your spending and otherwise avoid a higher marginal tax.


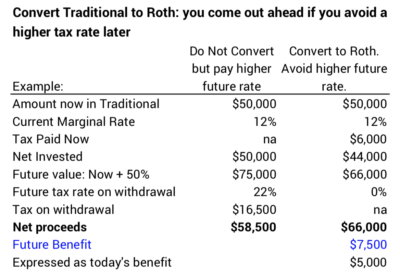
You never really lose when you convert Traditional to Roth. You never stop the advantage of tax-free growth in your IRA. If your future tax rate is the same as today, Traditional and Roth result in same net benefit to you. I don’t see how it is possible that you’ll withdraw for spending when you are in a lower marginal tax bracket than you are in now – that’s the only case where you lose when you convert Traditional to Roth.


The math of converting makes sense. Our intuition and emotion fights the math: we have a hard time deciding that it makes sense to pay taxes now to avoid taxes in the future.


== Two marginal tax brackets we’d like to avoid ==


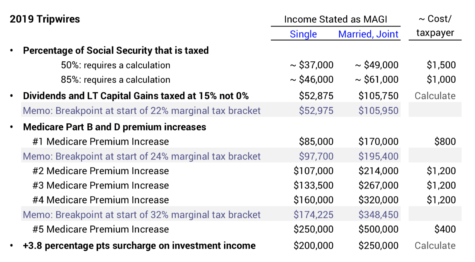
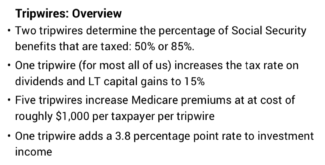
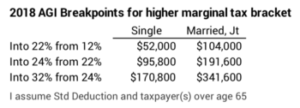
We retirees don’t want to waste money. We waste money if we pay taxes at a marginal tax rate that we possibly could otherwise avoid. We get to keep about 10% less of the income that’s taxed after these two breakpoints – $1,000 less per $10,000 of taxable income: 1) the step from 12% to 22% marginal tax bracket and 2) the step from 24% to 32% marginal tax bracket.


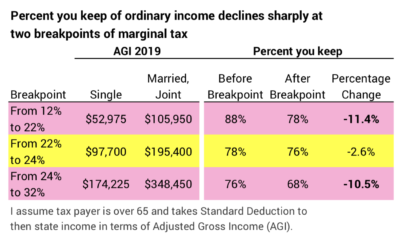
Folks facing these two breakpoints are obviously at very different levels of taxable income: roughly $240,000 difference in taxable income for married joint filers.


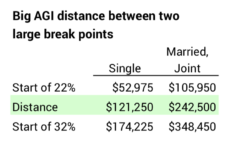
The step between the two – from 22% to 24% is one-fifth the damage of the other two. It costs us about $200 per $10,000 for the incremental income that falls into the 24% bracket. I would not be exercised about this if I were in this big range of income. I basically look at that long run of +$240,000 taxable income (married, joint) between the two big breakpoints as one very big tax bracket.


== Might you cross into a painful bracket? ==


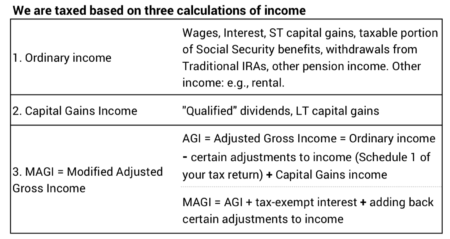
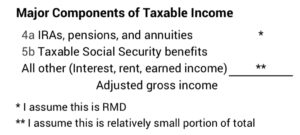
You need a simple forecast of future income to answer this question. I think the math is simple but it requires that we think in real, inflation-adjusted returns. I’m assuming you – like Patti and me – have (or will have when you are retired) two big components of ordinary income and All Other is generally in the noise level and won’t change in real terms over time. It’s simpler if we think about just three factors in this math: Social Security income, IRA income (RMD), and the marginal tax breakpoints.


== Two of the three never budge ==


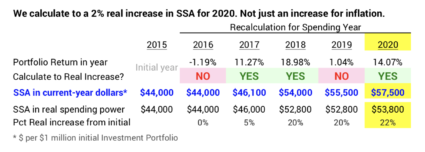
1. Social Security benefits stay at the same real spending power. [Social Security announced 1.6% Cost of Living Adjustment for 2020 in October.]


2. The breakpoints for marginal taxes under current tax law also stay the same. [The IRS recently announced 2020 breakpoints for marginal taxes that also adjusted for 1.6% inflation.]


== Your RMD will double ==


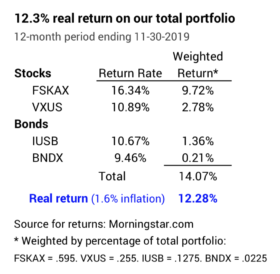
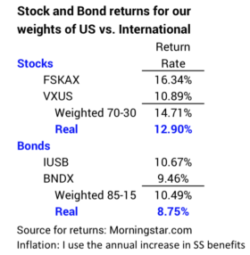
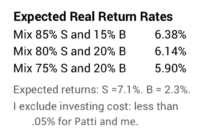
By your early 80s, your expected, real RMD will most likely DOUBLE the amount you will take in your first year. I went into some detail in the post I cited above. For the graph below, I used real expected returns for stocks (7.1%) and bonds (2.3%) and the mix of stocks and bonds that Patti and I selected: 85% stocks. A graph of results using a mix of 75% would look similar.


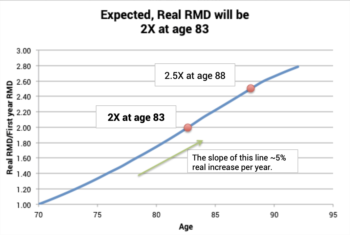
RMD increases in real terms from the combination of two factors: increasing RMD percentage and real increases in portfolio value.


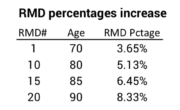
• My first year RMD percentage was 3.65%. When I am 80 it will be about 50% greater (5.35%). The RMD percentage will be more than double when (if!) I am 87.


• IRA portfolios will continue to grow at expected return rates because the return rate is greater than the RMD percentage for many years. The expected return rate on our portfolio is 6.38%. My RMD percentage first exceeds 6.38% at age 85.


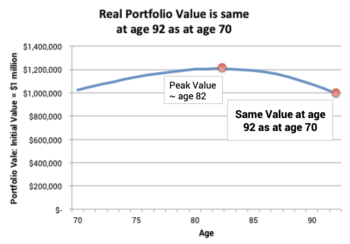
Real IRA portfolio value peaks in my early 80s and then declines. I have the same real portfolio value at age 92 as at age 70. A graph that uses a lower portfolio expected return rate – a lower mix of stocks than Patti and I have – looks similar.


== Use your 2018 tax return to get a snapshot ==


You want to know how much of your future income might be in a tax bracket that you would otherwise like to avoid.


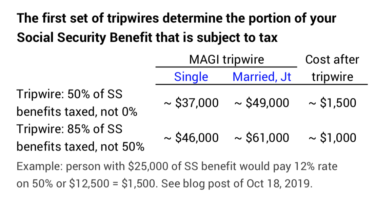
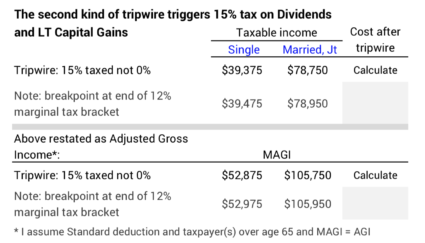
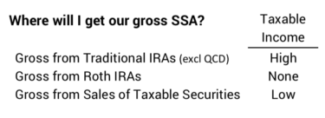
1. Pull out your 2018 tax return and simplify the entries to three. The first two items of ordinary income – IRAs and Social Security – are far bigger than All Other ordinary income for Patti and me. Remember that dividends and long-term capital gains income are taxed differently – 15% rate for Patti and me.


I assume you (or you and your spouse) received Social Security benefits in 2018, so that won’t change in real terms over time. If you are not subject to RMD, you’ll have to estimate your first year RMD. You need to estimate your IRA value for your first RMD. I’d use your current value and its expected return rate from now until then: ~6% rate. I’d use 3.7% of that estimate for your first RMD. Those two assumptions are close enough for this task.


2. Understand the tax bracket you are in and how close you are to the next marginal tax bracket.


3. Recast your return for what it will look like in the future. Double your first-year RMD, but don’t change the other two. (If you have already taken several RMDs, eyeball on the graph where you are to judge the expected increase: it will be less than double.) You have a new total. Now calculate how much of your income is taxed in the bracket that you would like to avoid. Calculate 10% of that: that’s the potential you could save in a future year if you could avoid that tax bracket. Is this an amount that concerns you?


My guess is that you will fall into one of three categories.


1. You are in a 12% bracket now and cross into a 22% bracket, but the potential dollar impact is not huge, and you just don’t have that much capacity to save on taxes: you have too little capacity to convert Traditional to IRA. This is Case 1 below.


2. You are near or in the 22% or 24% tax bracket and are miles away from the 32% tax bracket. It looks like you’ll never hit the 32% bracket. This is Case 2 below.


3. You are one of the fortunate few with a VERY LARGE Traditional IRA and can see you will have a significant amount taxed at 32%. You do have capacity to convert – you are not near 32% now, and the savings in total tax dollars saved is significant. You are lucky to have this problem!


== Two Cases ==


Case 1: Sue is single. She recorded her first RMD in 2018 on $600,000 in her IRA as of 12-31-2017. She is in the 12% bracket and not far from 22% tax bracket. She can see that when RMD doubles almost $17,000 of her total ordinary income is taxed at the 22% rate. That’s about $1,700 more in tax than if she stayed in the 12% bracket. She’d sure like to keep that $1,700 for herself. 


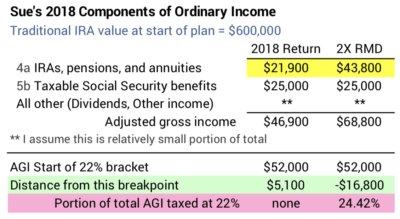
What can she do? Sue now is $5,000 from the 22% tax bracket. That’s her capacity to convert Traditional to Roth this year. That’s not a lot of capacity, but each time sheet converts she gets to keep 11% more of each amount she converts – that’s the effect of paying 10% now to avoid 22% later.

The math says Sue will save $550 if she converts $5,000 from Traditional to Roth, but she has to pay added tax of $600 (12% times $5,000) this year. The computational, logical part of her brain should decide this is the right thing to do. But the intuitive, emotional part of Sue’s brain is going push back – hard – on this. My guess is Sue won’t convert. It’s too tough to decide to pay more more tax now to avoid paying much less tax later.


========


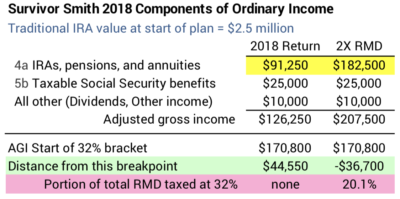
Case 2: The Smiths (Married, Joint filers) also both recorded their first RMDs in 2018 on a total of $2.5 million in their IRAs as of 12-31-2017. They are in the 22% bracket and some distance from the 24% bracket. They can see that when RMD doubles they’ll cross into the 24% bracket, but not by much. They would still be far from the start of 32% bracket. This is a weak case to convert Traditional to Roth as long as both Smiths are alive.


This is very different when one of the Smiths dies, because for a single filer the 32% tax bracket starts at half the taxable income for married, joint filer. In this example I lower Social Security benefits and keep all other income the same. Now 20% of RMD is taxed at the 32% bracket. The surviving Smith and heirs would be better off to pay more tax in the 22% and 24% tax bracket – converting Traditional to Roth – to avoid the big bite at the 32% bracket later.


Conclusion: At expected return rates, your RMD will double in real terms over your lifetime. This will push you toward a higher marginal tax bracket. You’d like to avoid two breakpoints of marginal tax rates in our current tax law: the breakpoint from 12% to 22% and the breakpoint from 24% to 32%. This posts suggests that very few of us will be pushed toward those breakpoints and also have capacity to avoid them. Married couples need to look harder at this issue, since the breakpoints high marginal tax rates are half that for married, joint files. You lock in your current tax bracket by converting Traditional IRA to Roth.

Might we all get a real pay increase this year?

Patti and I are +11 months into our performance year for my calculation of our Safe Spending Amount (SSA) for 2020: I use the 12 months from December 1 to November 30. My snapshot in this post tells me that we are just shy of a real pay increase for 2020. If you recalculate your SSA on the same date we do, you probably are just shy of a real pay increase. The purpose of this post is to show how close we – and likely you – are to that real pay increase. 


This year is turning out to be better than I thought. Our performance year started with a steep decline in our portfolio in December: -7.6%. At the six-month mark I wrote that it was almost certain we wouldn’t get a real pay increase for 2020. We’d just increase for a Cost of Living Adjustment. (Social Security announced COLA of 1.6% for 2020.) The market moved up sharply from May: +11% for US stocks, for example. All this is to say that Patti and I are close to a real pay increase on top of last year’s SSA + COLA. We need +1 percent return for the rest of November to get us that real pay increase.


== How do you get to a real increase in SSA? ==


You increase your real Safe Spending Amount in a year when returns are good and you have more than enough portfolio value for your current spending rate. You keep the same target year for no chance of depleting your portfolio, but you can do that at a greater real spending rate – you increase your SSA by more than last year + COLA.


You need to use a spreadsheet to track this calculation. We need to inflation-adjust our results to track what is really happening to the spending power of our portfolio. Remember: Think Real. You can see the spreadsheet I have used for the last four years here. The Resources tab on this site’s home page has a spreadsheet you can download to build your calculation sheet.


Two factors work together to tell us if we have a real increase in our SSA:


• Factor 1 is a good enough return rate this year. This is the big factor. You obviously have more than enough for your current spending amount when the annual return on your portfolio increases its value to more than its previous high-water mark.


Here’s a simple example. You end 2019 with $1 million portfolio value. You withdraw at SSR% = 4.5% or $45,000 for spending in on 2020. You spend or gift all that. During 2020, the real – inflation adjusted – return on your portfolio is +15%. You earn back the $45,000 that you withdrew and then add about 10% more in real spending power. Right before your next withdrawal at the end of 2020 you have $1,100,000 in the same spending power. If you apply the same 4.5% rate, you can with draw $49,500. You get a real 10% pay increase: $4,500 increase/$45,000.


• Factor 2 is the effect of an increasing Safe Spending Rate (SSR%). This is small factor for younger retirees but it’s a much bigger a factor when we hit our mid-70s and beyond. Because our Safe Spending Rate (SSR%) increases over the years, we actually can fall a little short of the past high-water mark and still get a real pay increase. Stated differently: as the years pass, we need less real portfolio value for the same real spending amount.


Our SSR% increases because our life expectancy is fewer and fewer years. [This why RMD percentages increases each year.] We nest eggers logically plan to the same year of no chance of depleting our portfolio – but it’s about one year less than this time last year.


Here’s a simple example. You end 2019 with $1 million portfolio value. You withdraw SSR% = 4.5% or $45,000 for spending for 2020. The 4.5% rate means you have 18 years for no chance of depleting your portfolio – to the end of 2037. (See Chapter 2 and Appendix D, Nest Egg Care.) You spend or gift all the $45,000. During 2020 you’re real return  earn back the $45,000 that you withdrew. Right before your next withdrawal you have the same $1 million in spending power. Your age-appropriate SSR% at the end of 2020 is now 4.6%: that still gives to the end of 2037 for no chance of depleting your portfolio. You apply that 4.6% rate to the $1 million and withdraw $46,000. You get a +2% real pay increase: $1,000 increase/$45,000.


You can read more on this is Chapter 7, Nest Egg Care. I also described how these two factors combined for our 15% real increase in SSA in December 2017.


== Our portfolio return rate for +11 months is ~11% ==


Our portfolio has grown in dollars by 10.8% from December 1 through November 5. that’s a real return of 9.1% when I adjust for inflation. That rate is the combination of the horrible return in December 2018 and the very good 2019 Year-To-Date returns.


You can see that bond returns are close to stock returns. That means total portfolio returns don’t vary much over a range of mix of stocks vs. bonds.


The 9.1% real return isn’t enough to get us to the previous high-water mark of portfolio value. We didn’t just have to surpass the portfolio value on November 30, 2018. That wasn’t the high-water mark. We had to beat the value on November 30, 2017. Patti and I withdrew about 4.8% that December for our spending in 2018; the real return for that year was -1.7%; and last December we withdrew about 4.8% for our spending this year. Those add up to more than -9.1%.


Our age-appropriate SSR% has increased since December 2017, meaning we don’t quite have to reach the prior high-water mark. But that’s not helping enough. The two factors don’t combine to a greater real SSA.


I can plug in return rates in my calculation spreadsheet and find the return rate that would give us a real pay increase. We need a nominal return of at least 12% – a real return that’s a shade over 10% – for the 12 months ending this November 30. That’s about one percentage point more than we have now. If the return for the balance of November is +1%, we’ll pay ourselves a real increase for spending in 2020.


== Your math may work out better ==


My guess is that you are younger than Patti (72): her age and life expectancy determine our age-appropriate SSR%. That means your SSR% has been lower; you’ve been taking less from your portfolio. You need less return to get back to your high-water mark of November 30, 2017. That 10.8% return alone could get you to a new high-water mark.


Conclusion. Returns for the first +11 months of our performance year are good: +11% on our portfolio. That’s not enough for us to calculate to a real increase in our Safe Spending Amount for 2020. We need a return rate that overcomes the withdrawal in December 2017, the negative real return in 2018, and the withdrawal in December 2018. +11% just doesn’t quite do that. If we gain 1% more by the end of this month, we will have enough for a real pay increase in 2020. That would be the third real pay increase in the first five recalculations of our plan.

How do you manage your 2019 income to avoid $1000 (or more) tax landmines?

The purpose of this post is to describe seven hard-to-see tripwires for landmines that can result in taxes that you might be able to avoid. If you stumble on a tripwire and set off a landmine – cross a specific amount of income you record on your tax return by $1 – you could see your tax bill go up by perhaps $2,400. We retirees can avoid the tripwires: we have a degree of control over our taxable income. We choose where we get the money that we want to spend in a year. Our choices have different tax consequences. We can tweak our taxable income for a given gross amount that we want to spend and avoid taxes that we would otherwise pay.


We can accidentally set off land mines that blow away up to $2,400 when we record a just a hair too much Modified Adjusted Gross Income (MAGI) on our tax return. Your MAGI is Adjusted Gross Income with the addition of some items you did not include on page 2 of your tax return. An example is that you add back tax-exempt interest to AGI to get to MAGI. My tax preparer emailed me a .pdf file of our 2018 return and a bunch of supporting schedules. One calculates our MAGI. Patti and I had nothing to add back to AGI to get to MAGI, and that will hold true for 2019. AGI = MAGI for us.


== Three kinds of Landmines: seven tripwires ==


We have three kinds of landmines with specific tripwires that result in a big jump in total tax: 1) two tripwires result in a greater percentage of Social Security that is taxed – jump from zero to 50%  and then 85% taxed; 2) a tripwire that jumps the tax rate on dividends and long-term capital gains from zero to 15% ; and 3) four tripwires each increase Medicare Premiums per year by roughly up to about $1,200 per individual.


[In this table I excluded tripwires at very high MAGI: the ~$435,000 tripwire for 20% capital gains for a single filer; ~$489,000 for joint, married. And the last $500,000 tripwire for greater Medicare Premiums for a single filer; $750,000 for joint, married.]


== Estimate your 2019 MAGI now ==


I estimate my 2019 MAGI using my 2018 return as the starting point. See spreadsheet that I use here. You’ll need to do this to find if you could stumble on a tripwire. I can tweak the three sources of our SSA to adjust MAGI if I think I might stumble across a tripwire described below. This spreadsheet also estimates my total taxes for the year so I know how much to withhold when I take our RMDs in early December. (Patti and I are both subject to RMD.)


== Landmines at relatively low MAGI ==


Retirees who have relatively low income other than Social Security benefits and financial nest eggs generally less than $500,000 per individual may be able to avoid two landmines. Folks with some outside investment income income and larger financial nest eggs – especially when subject to RMD – will blow by these landmines and incur greater taxes.


• Greater MAGI triggers a greater percentage of SS benefits subject to tax. You have to calculate to find your tripwires. Your tripwires are affected by the amount of your SS benefit. This blog post from two weeks ago has a more detailed discussion. This example below shows that a single filer will cross the first tripwire – resulting in 50% of SS benefits being taxed – if MAGI other than the SS benefit exceeds $12,500. They cross the second trip wire at $21,500 of added MAGI.


• Greater MAGI triggers a jump in the tax rate on Dividends and on Long term Capital Gains from the sales of securities. The rate jumps from zero to 15% when total MAGI crosses the trigger point of about $39,000 for a single taxpayer and about $79,000 for married, joint filers. Again, a single taxpayer reaches the tripwire without a large amount of MAGI in addition to the assumed SS benefit.


 == Landmines at high MAGI ==


There’s a big jump in MAGI to reach the next set of landmines. Much greater MAGI trips added Medicare Premium payments. (See here for an earlier discussion.) The first tripwire hits at $85,000 MAGI for a single and $170,000 for married, joint. Tripwires are roughly every $25,000 thereafter for single and $50,000 for married. Each tripwire triggers about $1,000 added annual premiums per person. For Patti and me, increased Medicare Premiums would br deducted from our Social Security benefits because our basic Premium is deducted.


You don’t immediately see the effect if you cross over the tripwire. You see it a year later. Your 2019 return affects your premium penalty payments in your 2021 SS benefits. You send your 2019 return to the IRS in April 2020. The IRS calculates your MAGI. You get your statement of your 2021 SS benefits in late 2020. That statement will reflect the added premium for tripwires you crossed on your 2019 return. The 2021 premium increases will adjust for inflation and  will be a bit higher than I display in the table above.


== Actions to take when near a tripwire ==


Back away when you are near a tripwire! Record lower MAGI! You can fiddle and keep the same gross amount for spending but lower MAGI. You have three choices to lower MAGI: distribute from your Roth IRA rather than Traditional IRA; get more of your gross cash for spending from sales of securities than from your Traditional retirement accounts. You could choose to pay yourself less than your SSA.


If you think you’re going to face the same landmine you want to avoid in future years, you could blow by the trip wire that’s close and get near to the next one. You’d choose to pay yourself more this year with the plan of plan of paying less in future years – you’re prepaying a bit of your future SSA in effect. You gain the same benefit if you convert Traditional to Roth IRA.


Conclusion: $1 of added income on our tax return can trigger up to $2,400 in added tax. The tripwires of Modified Adjusted Gross Income (MAGI) that result in these high costs are not easy to see. This post displays a total of eight trip wires. You need to estimate your taxes for this year to see if you are close to a tripwire. Back way if you are close! You back away by tweaking your reported income: you decide how you will get the cash you want to spend, and what you choose has different effects on taxable income.