All posts by Tom Canfield

How do Retirement Withdrawal Calculators build their sequences of return?

Two types of Retirement Withdrawal Calculators (RWCs) build sequences of future financial returns we test to make the key decisions for our financial retirement plan. I used to think that the two types were about the same for planning purposes. I no longer trust one type of RWC – the one that uses the Monte Carlo method to build and test sequences of returns. I don’t get to that final conclusion in this post, however. The purpose of this post is to describe the two ways these RWCs build their sequences of return.


(You get good view of RWCs and how they work in Chapter 2 Nest Egg Care (NEC) and in this post.)


The two types of calculators are best represented by FIRECalc and the Vanguard Retirement Nest Egg Calculator. Both use annual returns for stocks and bonds from 1926 to the present (That’s how I use FIRECalc; it could stretch back to 1871.) But they develop the sequences of annual returns they test differently. FIRECalc assembles its sequences of returns in the year-by-year order that they incurred. Vanguard uses the Monte Carlo (MC) method that assembles sequences with annual returns in a random order.


== Why am I concerned about this? ==


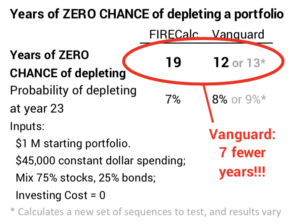
I want to discuss this topic because the Vanguard RWC ALWAYS displays a fewer number of years of ZERO CHANCE of depleting a portfolio than FIRECalc. Use them and see for yourself: the table here shows that with the exact same inputs, the Vanguard RWC displays seven fewer years of ZERO CHANCE for depletion. Seven years? Wow.


The more I look into this the less I think that is correct: my thinking is that it should be the opposite. FIRECalc should ALWAYS show fewer years of ZERO CHANCE of depletion than the Vanguard RWC. In this post I cite that some of the actual bad period of returns are inconsistent with probabilities based on random ordering of returns. What gives?


I recognized the difference in results of the two when I was writing Nest Egg Care. I discuss the differences in Appendix C. When you look at the probability differences over a number of years (See graph C-2, NEC), the two are close. But that difference in years for ZERO CHANCE for depletion has bugged me for years.


== The MOST HORRIBLE sequence of returns ==


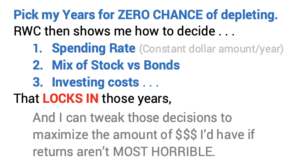
We nest eggers use an RWC and focus on the absolutely MOST HORRIBLE sequence of returns we would ever expect to see. It’s the cornerstone of our financial plan. We get the simplest view of the safety of our financial plan by answering the question, “Given my decisions on spending rate and how I will invest, how many years do I have for ZERO CHANCE of depleting my portfolio?” We pick the number of years we want for ZERO CHANCE of depleting our portfolio, and our RWC leads us to the key decisions on spending rate, mix of stocks and bonds, and investing cost.


== The two ways to build sequences of return ==


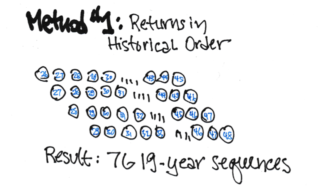
Ordering Approach #1. This is how FIRECalc builds its sequences. This is the easiest method to explain and understand. Each segment of returns is constructed from the exact sequence of annual returns as they occurred in the past. Let’s assume we are building 19-year sequences of returns. The first sequence starts in 1926 and runs to the end of 1944. The next sequence starts from 1927 and runs to the end of 1945. And so forth. You’d have 76 19-year sequences.


FIRECalc uses  a constant dollar withdrawal amount – an amount that adjusts for inflation each year – and real, inflation-adjusted annual return rates to calculate how a portfolio fares over time. That makes the math easy. You see how a portfolio fares in terms of changes in real spending power. I show a spreadsheet that illustrates the calculations to see how a portfolio fares over time here.


Using this method, you find how your portfolio would have fared in spending power for your inputs (e.g., spending rate and mix of stocks vs. bonds) if you retired in 1926, 1927, and so forth. One of those is MOST HORRIBLE that results in the fewest years of ZERO CHANCE of depleting your portfolio.


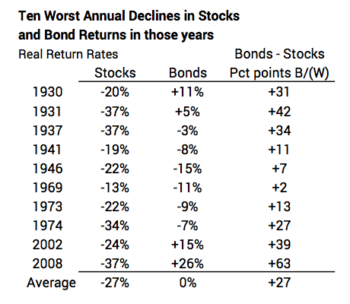
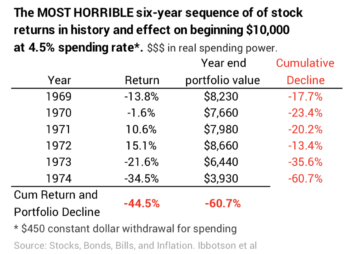
When you look under the hood of FIRECalc, you find the most horrible sequence of returns is the one that started in 1969. I narrowed in to find that sequence just by looking at the graph of real returns over time shown in this post: that time period was the clearly the worst for both stock and bond returns.


That 1969 sequence will lead to the fewest number of years until first depletion for any set of inputs. This is primarily because it has MOST HORRIBLE first six years of stock returns by a long shot, and bond returns (not shown in the table below) don’t save you. This table show what happened to the stock portion of a portfolio over those six years. That 60% decline in real spending power is well below a portfolio’s tipping point. When you assume the same spending amount year after year, it can’t even maintain that low level of spending power and  it spirals to zero.


Ordering Approach #2. This is how Vanguard builds its sequences of returns. The Monte Carlo method generates sequences with annual returns in random order. The implicit assumption that each year’s result is totally independent of the others; no events would predict increases or declines in returns. One sequence could be in the order of annual returns for 1927, 1981, 1941, 1967, 1953, 2004, etc. Another one could be in the sequence of 2013, 1974, 1995, 1947, 1986, 1931, etc.


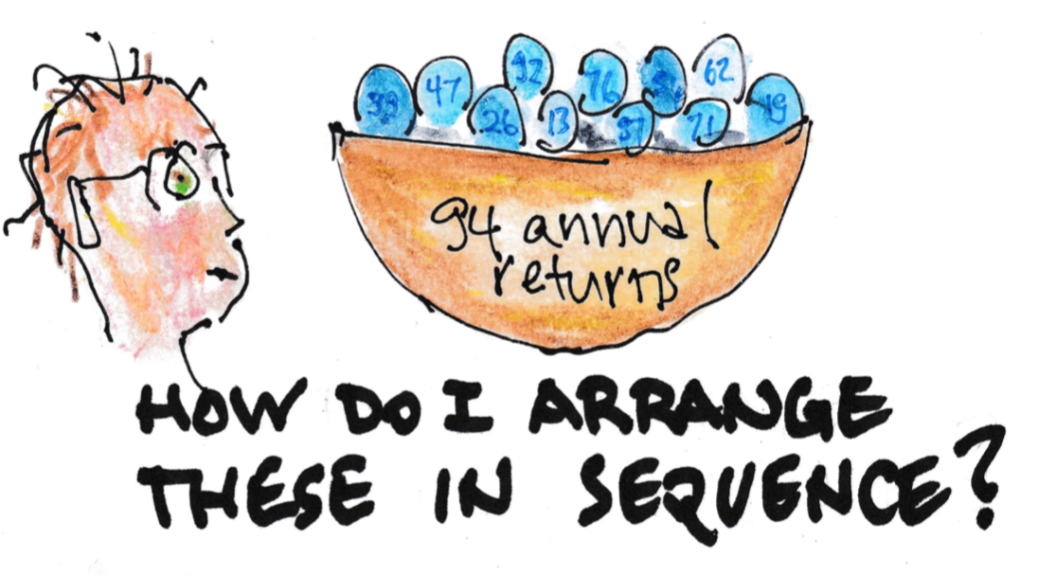
The method follows a fairly complex set of steps to generate its sequences of return that it will test. Let’s again assume we’re building 19-year sequences of return. We need to think if a matrix that is 19 columns with each column 94 high. The method first randomly orders all 94 years of returns and dumps then into column #1 of our matrix. It does the same for column #2, and so on until all 19 columns are filled. The matrix is complete. We have 94 rows, each 19 years long. Those 94 rows are our sequences of returns to test. One of those will be the MOST HORRIBLE sequence.


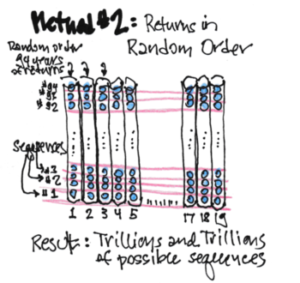
The total number of possible combinations of return sequences from this approach exceeds the number of stars in all the galaxies. A computer is so fast that it’s easy to build far more than 94 rows of sequences to find the one that is the worst. You can think of that as stacking matrices 94X19 on top of each other. It’s so many possible sequences that the RWC has to use a representative sample of all the possible sequences to find the MOST HORRIBLE one (or the small group of the most HORRIBLE ones). A computer is so fast in calculating that these RWC’s use 100s or even 1000s of sequences to find the MOST HORRIBLE one. (Vanguard tests a different 100,000 sequences for each set of inputs!!! That sounds impressive. Is it?)


A Monte Carlo RWC never prints out its MOST HORRIBLE sequence so that you can look at it. You can’t compare Vanguard’s MOST HORRIBLE 19-year sequence to the MOST HORRIBLE one from FIRECalc (1969-1988), for example. You get the result of the number of ZERO CHANCE years – and the probability of depleting in future years – but you’re not sure how it got there.


All the Monte Carlo RWCs that I find – Vanguard’s is a good example – input nominal returns, not real, inflation-adjusted returns. This is where it gets dicey: these calculators don’t think real and get twisted in their underwear when they are tracking what happens to portfolio value over time. This is the source of the BIG DISTORTION in results. I’ll explain this detail in the next post.


Conclusion. A Retirement Withdrawal Calculator (RWC) is an essential tool for our financial retirement plan. The MOST HORRIBLE sequence that our RWC builds is important: it gets us to  simplest way to understand the safety of our plan. We use that one sequence to get to our Safe Spending Rate (Chapter 2, NEC).


Two kinds or RWCs build sequences of returns we might face differently: 1) in historical order that returns occurred or 2) in a random order of annual returns. These two methods are best represented by the RWCs from FIRECalc and Vanguard. These two, unfortunately, show a different result for the number of years of ZERO CHANCE of depleting a portfolio for the exact same inputs. This post describes how they build sequences of return to test with our plan inputs. Next week’s post describes how RWCs that use the Monte Carlo method to build sequences mangle their results to get that different result.

How will you live UNTIL VACCINE?

What can each of us do to fight this damn virus? How will you live your life to be sure you don’t get infected and possibly die? The purpose of this post is to describe how Patti and I are thinking about how we will live UNTIL VACCINE. This article and its embedded videos and links had a big impact on me. Read and watch.


== My daily self-talk: “It BADLY wants to kill me.” ==


Plan for the worst case. I believe in planning that assumes the worst case possible. That’s the whole focus of Nest Egg Care. You assume the worst will happen – the worst sequence of financial returns ever. You set your spending rate and investment strategy accordingly. You have an action plan to avoid the WORST ­– you know you won’t run out of money in your lifetime. Right now, the WORST is this virus that can get inside of me, run wild and kill me.


It’s an efficient and effective killer. It’s efficient because no one is immune, and none of us can stop it. It runs wild in the beginning, easily finding victims. It only slows down when it gets harder and harder to find a new victim. That point of greatest difficulty comes when about 65% are immune – either because they’ve gained immunity by recovering from a prior attack or because they’ve been vaccinated.


It’s most effective on the oldest and weakest. The current data for our county shows that for people roughly my age, it kills more than 25% that it infects. While most all these folks were residents of nursing homes, that rate also applies to folks my age who live independently, like Patti and I do.


I’d be nuts to assume that 25% doesn’t apply to me. I’d like to think many, many more have already had it, meaning that 25% rate is far, far too high. I’d like to think I’m in much better health than those it’s attacked and killed. But I have NO data to tell me that either of those might be true.


I also should assume it will be a more effective killer next fall and winter. Even though I always get a flu shot, I seem to always get the seasonal flu and it knocks me down. Weakens me. If it infects me ON TOP OF the normal seasonal flu, I very likely could be doomed.


It’s an invisible killer. It wants to get inside me from invisible particles of spit or snot from a person it’s recently infected or a person who’s a carrier. The pre-sick folks can shed the virus for days before they know they are sick. The carriers – the ones who have it but don’t get sick – can shed virus for many days. We have no idea how many days. Both feel perfectly fine. They look fine. The virus says, “Please go about your normal life. Please get close to other people. And whatever you do, don’t wear a mask.”


When these folks speak or even breathe heavily, they spew out very small particles that contain the killer. If they cough or sneeze, it really flies out of them. I could directly breathe the particles. They could land on my face or clothes. When particles land on surfaces, the killer can live there for DAYS. Without thinking, I could touch my clothes or surfaces with the killer on them. Then without thinking I could touch my eyes, nose or mouth. And now I’m cooked. I could die in a couple of weeks.


It’s all around me: I think at least 3% of all people I see harbor the killer. Our county is a small sample size, but I think I’m being conservative with the data to say roughly 3% actively harbor the killer. Again, more data may tell a different story, but right now I should view that 3% of all people I see harbor the killer that’s looking for me.


The chance of being near the killer is high. If Patti and I are in a restaurant with 25 others, it’s more than 50% probable that at least one harbors the killer. My barber probably sees close to 50 customers a day – he’s a very busy guy: it’s almost 80% probable that he’s cut the hair of at least one killer. On a plane with 150 passengers, it’s 99% probable that at least one harbors the killer. One sneeze, one cough, one small invisible cloud of spit and snot and . . .


The risk of bumping into IT decreases when less of IT is in the population. Over time less of it will be in the population. But even if the rate IT is in the population is 0.5%, would I want to be in a group of 25 with an 11% chance of IT being there? NO.


== What are our rules to keep alive ==


Follow the general rules: wash your hands; don’t touch your face; get no closer than six feet from anyone; wear a facemask: it helps others.


House and car: Cocoon and mini-cocoon. NO ONE other than Patti and I get inside. Continue to pay Cindy not to come to clean. We can live with dust balls and actually clean up a bit ourselves. We can forego the routine workers who normally come inside once or twice a year: the AC and furnace checks can wait.


Gear for outside: Never leave house without four things: face mask, gloves, wipes in a plastic snack bag, and pocket-sized hand sanitizer. Keep duplicates in the cars at all times.


Car rules: wipe door handles on entering if the car has been outside of our garage. Limit the number of times we have to touch a nozzle at a filling station. Drive very little. Use our electric car as much as possible.


Rules for exercise: Long walks: always have the mask on our ears; put it on if we get within 20 feet of anybody else. I’d hope to heck that they do the same. Otherwise, we don’t have the mask over mouth and nose. Never go to the JCC for our usual exercise classes. Too much heavy breathing and invisible clouds in the room. They’re streaming the classes live now. Good move.


Shopping rules. NO shopping in stores other than the grocery. Limit that to once every other week. Pick less popular times to shop. We have not yet arranged on-line shopping for groceries and may try that.


ALWAYS wear mask when in a store. Strictly adhere to the distance rules. Stay at least six feet from everyone. Stay ten feet if someone is facing us and talking. I’ll do the same for them if I am talking.


It’s safer if Patti shops. The killer seems to prey on men more than women. I’m not as detailed at following the routines to keep totally safe.


Do not touch any surface – door handles and elevator buttons in particular – without disinfectant wipe and/or wearing gloves. Think of every surface as covered with a thin layer of snot. Don’t let that snot get in my mouth, nose, or eyes. We practice this at home so that it will become second nature when we’re out.


NEVER shop at a store where employees or other customers do not have on a mask. (Mandatory now, but may not always be.) If an employee fails to wear a mask UNTIL VACCINE, tell the store management that they have lost our business for a very long time. (I don’t think I’ll say, “For as long as we’re alive.” He or she may think, “Heck, that’s likely only a couple of months from now.”)


Always wipe down everything that enters the cocoon before it’s put away.


Restaurants. We won’t eat out UNTIL VACCINE. Too dangerous. At our age, you’d have to be nuts to eat in one. We will only do carryout and follow the rules when we pick up our food.


The future economics for restaurants and staff are horrible. I now tip $20 for all carryout orders. We do that about twice/week. This week I am starting to add $20 to the bill for the restaurants. That’s $20 for the staff and $20 for the restaurant. Less than $400/month.


Movie theaters, concerts, plays, sporting events. Totally off limits. We’ve donated this year’s subscription tickets.


Travel. NEVER fly on a plane UNTIL VACCINE. Too many people, too close. We cancelled our annual trip to England. We will cancel a trip to Tuscany planned for the fall. We don’t want to stay overnight anywhere. Something will have to be different for me to feel safe staying in a motel, hotel, or bed and breakfast. We don’t take cruises, but, as Dr. Fauci said, “Just don’t get on a cruise ship.”


Hair. The barber is high risk. I think I will just let my hair grow. I may go if I am the first customer of the day and the cleaning routine is clear. Or, maybe Patti cuts it; she used to cut it 50 years ago. It looked like hell.


Dental and health. Our dentist sent a detailed description of what they will do to protect customers and staff. I dread the thought of someone’s hands in my mouth. Teeth cleaning can just wait UNTIL VACCINE. I have one scheduled physician visit in June, and he does not need to touch me for the visit. I hope telemedicine will work. A toenail is growing weirdly on one toe. I probably should see a podiatrist. It’s uncomfortable but not restricting me. I’ll try to wait as long as possible. Maybe Patti will have to become a toenail surgeon.


Conclusion: Patti and I are planning on the WORST case. The virus badly wants to attack us and the data to date tell me it has a good chance of killing folks our age if we let it in. Some of our ideas to KEEP IT OUT may sound crazy, but I think they give us the best chance of being alive UNTIL VACCINE. Get exercise; eat right; stay healthy; be kind and hang in there so you can get back to ENJOY MORE. NOW. After the vaccine.

Can you pull the trigger to sell a sick actively-managed fund to then buy an index fund?

Let’s assume you followed last week’s post and found you have a couple of stock funds – or even stocks– in your taxable account that just aren’t performing. How do you decide to pull the trigger to sell and take the net proceeds and buy an index fund? You’ll pay tax now and have less to invest. But you’re pretty sure you’d make some of that up with higher future return from the index fund. The central question is, “How long does it take to make up the difference such that I’ll have more in the future?” The purpose of this post is to help you make this decision. In summary, you’ll find that it doesn’t take very long at all to come out ahead with the index fund. Pull that trigger.


Just to be clear. We’re talking about funds ­– or stocks – you have in your taxable account. It’s easy to pull the trigger in your retirement account: taxes don’t figure into the equation. If you are following the plan in Nest Egg Care (NEC), you sold all your actively managed funds and stocks a while back, and you just have two stock funds and two bond funds in your retirement accounts. (See Chapter 11, NEC.)


== Inertia not to act: fear of taxes ==


Most folks hang on to actively managed funds in their taxable accounts that they don’t really like because they HATE the idea of selling and paying capital gains taxes now. Hey, I HATE paying taxes, too.


Some folks I know think they should NEVER SELL a sick fund or stock. Their thought is to hang on for the rest of their life (or lives if a couple) to avoid paying capital gains taxes: when they die their heirs inherit the fund; their new cost basis is the value on your date of death. You avoid capital gains taxes in your lifetime(s); heirs don’t pay tax on your accumulated gain. NOTHING can be better than NEVER paying gains taxes! You must come out ahead on this, right? NO! This is faulty logic.


This is analogous to my friend Roy, who I mentioned in this post. His accountant advised him to hold on to his rental property until he dies so he and heirs never pay gains taxes. But he’d be much better OFF to sell now, pay the taxes, and put the net proceeds in a stock index fund. It’s basically the same logic for this case of selling a sick stock fund and buying an index fund.


== The critical assumption ==


The critical assumption is that you ultimately will sell the fund – or stock – you have sometime in your lifetime. Why? I assume you’ve decided to pay yourself your annual Safe Spending Amount (SSA; see NEC, Chapter 2). Your SSA is always greater than your RMD. You therefore annually will always sell securities from your taxable account to get cash for your spending; those sales are always lower in tax cost than the alternative of taking more from your retirement accounts.


The math works out that year after year you will take a bigger share from your taxable account than your retirement accounts. Over time you’re taking an even bigger share from your taxable account. Patti and I have seen this: much less of our total is in our taxable account than in our retirement accounts. When we are in our 80s, almost all our financial assets will be in retirement accounts. If we live to our life expectancies, we’ll have very little in out taxable account.


This assumption makes the focus on your future after-tax return. You pay taxes now when you sell or you will pay taxes later when you sell. You lose potential growth because of the taxes you pay now, but you make that up over time assuming your return rate is higher from the index fund you will buy. The question becomes, “How long is that time?”


== Should Jay sell FMIHX now? ==


Spoiler alert: YEP. And others.


Last week I ranked nine of Jay’s actively managed funds in his taxable account. I show the three stinkers below. I need to pick one as an example. Two months ago, I picked on JENSX, so I’ll use FMIHX – FMI Large Cap Investor – as the example for this post. It’s not quite the worst, but if it makes sense to sell FMIHX, it likely will make sense to sell others.


I can get more than just three years of results from the Morningstar site to double-check. The table below shows FMIHX has lagged for all time periods over the last decade. (I gathered this data in early March; I don’t have possible distortions from the recent decline.)


Morningstar also reports that FMIHX has had very high capital gains distributions. (You find that on the Performance page; you have to click on “Distributions” right next to “Returns”.) I talked about this penalty two weeks ago. I calculated about a .2 percentage point penalty in return per year for a typical actively managed fund. But FMIHX is not typical. It’s had unusually large capital gains distributions. They have been so large that the current price of FMIHX less than 3% more than it was in December 2011. That means Jay has paid a lot of gains taxes over the years, and his current cost basis must close to the current price. Jay records little gain if he sells now and will pay very little gains taxes.


== Jay’s inputs to the decision ===


Jay has to find one fact and make one assumption to make his decision of whether or not to sell FMIHX and take the net proceeds to buy its peer index fund. He plugs two basic numbers in the spreadsheet you can download here, and he will find how long it takes to come out ahead with the index fund.


1. Jay needs to find his cost basis/share. Jay’s held FMIHX for over a decade. His cost basis is less than the current price. For this example I’ll assume that Jay’s cost basis is 65% of the current price. Because of the gains distributions, I’d guess it’s at least 90% though.


2. Jay needs to plug in his assumption of the deficit in return if he sticks with FMIHX. I look at past performance and could easily conclude that FMIHX will continue to under-perform its peer index fund by two percentage points per year.


I’ll be very generous to FMIHX: I’ll assume its future performance lags its peer index fund by .8% per year, which is just about the difference in its expense ratio between the two. That means I’m not penalizing FMIHX for its consistently poor record of stock-picking. I’ll also set its future capital gains distribution to zero percent. These assumptions seem ridiculously conservative to me.


Here are the summary results from the spreadsheet with those two inputs and tax rates Jay pays: Jay comes out ahead on this transaction in less than one year! And the advantage of holding the index fund grows year after year. The improvement in growth outweighs the penalty of paying taxes earlier. Jay, SELL FMIHX NOW and buy a Total Market Index fund like VTSAX or FSKAX* or an ETF like VTI or ITOT. Also sell the other two sick funds – JENSX and VCHOX. (*Patti and I own FSKAX.)


== Rules of Thumb ==


When you input different assumptions in the spreadsheet, you will find different break-even periods. Unless your cost basis is very low, I conclude the time to break-even from the index funds is short. I suggest these rules of thumb:


• If you think your active fund will under-perform its peer index fund by one percentage point per year, sell it NOW and buy the peer index fund.


• If you think your active fund will under-perform by one-half percentage point per year, you have little reason to keep it. I would sell TWEIX and FCNTX, for example. (See last week’s post for their expense ratio and performance.)


I would alter this advice for three actions you may prefer. 1) If you know you will be selling from your taxable account for your spending in the next year or so, just wait and sell the stinkers first. 2) Gift these funds to an person who does not pay capital gains taxes; that’s someone who is in the 12% marginal tax bracket; have them sell it and buy the index fund. 3) Donate these shares to charity; you don’t pay gains taxes; depending on other itemized deductions, you may some or most of the full market value of the donation as a deduction from income. It’s simpler for you and the ultimate charity or charities if you first donate to a Donor Advised Fund. I think the largest of these are at Fidelity, Schwab and Vanguard.


Conclusion: You need to find one fact and make one assumption to decide to sell an actively managed fund in your taxable account and then buy an index fund with net proceeds. You need to know your cost basis/share as a percentage of the current price/share. You need to estimate the deficit in future return from your current fund relative to its peer index fund. This post provides a spreadsheet to help you find when you would come out ahead with an index fund. Generally, the time is very short. It was less than one year in the example used in this post.

How do you rank performance of your actively managed funds?

I’d guess that many retirees – and clearly many investors – have a lingering legacy of actively managed funds in their taxable account. The market has declined, and this a good time to consider selling an underperforming actively managed fund. You’d sell and invest the net proceeds in an index fund. Yes, when you sell, you’ll pay capital gains taxes now and have less to invest, but you’ll make that up: +90% of index funds will outperform over time. The key question is, “How long will it take for me to recoup – to have more in the future by selling my actively managed fund and switching to an index fund?” That’s primarily going to depend on your assumption of future performance of your actively managed fund. This post builds on last week’s post and describes how I would pick the funds that would rank at the top of the list to sell.


Next week I’ll run through the exact math for that decision. Spoiler alert: it takes very little time to recoup.


== Factors in your decision ==


Last week, I listed the factors for this decision. I knocked off #2c at the bottom of the list below. You pay a penalty of about .2 percentage points per year because of on-going taxes you pay on capital gains distributions from actively managed funds. We’ll see in this post that factors #2a and #2b potentially swamp that bad result. I focus on those two factors in this post. We’ll just keep the added .2 percentage point penalty from in the back of our minds for now.


== How I would rank funds to sell? ==


I’m going to use the example of nine actively managed funds my friend Jay owns in his taxable account. Jay’s held these for more than ten years. He spent A LOT of time and effort to pick high performing funds over a decade ago. I’ll guess that all of these were Morningstar five-star rated funds at the time he bought them. He tells me he bought more than 20! He got rid of those he didn’t like, and these remain. How would I look at these nine if I owned them?


== 1. Arrange by style and display Expense Ratio ==


I reorder the funds by style and display their expense ratio. I get the style for the fund on the Morningstar (M*) Performance page for the fund. I get the Expense Ratio on the Quote page and also on the Price page. These funds fall into three of nine styles: Large Cap Growth, Large Cap Blend, and Large Cap Value. See this post for all nine styles and the peer index funds I use.


Why do I focus on expense ratio? I think you’ve got this. It’s a ZERO-SUM GAME for actively managed funds before costs: actively managed funds in aggregate MUST earn the same return as their peer index fund before its costs. The net return to investors from actively managed funds HAS TO BE LOWER by the difference in costs – annual expense ratio. That makes it LESS THAN A ZERO-SUM GAME FOR INVESTORS of actively managed funds. That’s basically why +90% of actively managed funds under-perform their peer index fund over time. (See here and here if you are foggy on these points.)


The expense ratio of these funds averages .8 percent. The expense ratio of the peer index funds average about .1 percent. That’s .7 percentage point difference in cost per year. I’d expect these funds to average .7 percentage point less in return. Nine is a very small sample of actively managed funds and three years is not that long of time: the result may be off one way or the other.


More importantly, I’d expect these funds in aggregate will under-perform in the future by .7 percentage points per year. If I add the .2 percentage point penalty for taxes on capital gains distributions I found last week, I’d conclude .9 percentage point less in annual return. That’s quite a hit: you’d expect – meaning you assume your actively managed funds perform on average – that you’d incur  about 20% penalty in growth from your actively managed funds.


== 2. Compare performance relative to peer index fund ==


I compare a fund’s performance to its peer index fund. Morningstar displays how each fund’s performance compares to its peer benchmark index. Comparing to an actual fund you could own is fairer.


For this comparison I picked the annual return rate over three years. The Performance page for each fund on Morningstar shows average annual return data over a number of holding periods. I think three years a good time period. You could pick a different time period, though, since M* shows performance for a number of time periods. I gathered this data in early March; that’s good, since I don’t want to throw the effect of the steep decline since then into this comparison.


What do we find? Even though the sample size is small, the under-performance of actively managed funds generally follows the pattern I’d expect. The average performance of the five Large Cap Growth funds is close to the difference in expense ratio. The average performance of two Large Cap Blend funds is almost exactly the difference in expense ratio. The average two Large Cap Value funds performed better than their peer index fund.


You can see that Large Cap Growth was the winning style over the last three years. (That’s been true for longer than that). Its average annual return of the peer index fund was +14% while Large Value was +5%. The market as a whole represented by VTSAX was +9%. That’s good for Jay: I don’t know how much he has invested in each fund, but this would indicate he made a smart – or lucky – choice years ago to have more in Large Cap Growth.


== 3. Stock picking adds more variability ==


The fund manager’s stock picking ability or luck in choice of stocks magnifies or lessens the impact of a fund’s cost difference. Some managers will be good stock pickers or lucky and others won’t. I highlight in green the four funds that outperformed their peer index by more than one percentage point. Two funds in yellow were just a shade below their peer index fund. Three funds in pink under-performed by more than two percentage points.


The comparisons are easier to see when I regroup by level of performance in the tables below. Now we’re getting there. I want to focus on that third group of funds highlighted in pink. These look like the top candidates to sell: JENSX, FMIHX, VHCOX. None of those give me confidence that they’ll match their peer index fund in the future. I’ll focus on the exact math to use to decide if you should sell in the next post.


Conclusion: The market has declined. This is a good time to decide if you should sell an under-performing actively managed fund in your taxable account and replace it with a peer index fund. You need to rank order your funds. I get the data to do this from Morningstar. In this post I looked at nine funds my friend Jay owns. I found three that have badly under-performed. They are the prime candidates to sell. Next week I’ll provide the math steps to decide specifically what I’d do with these.

What’s the tax cost of actively managed funds?

The market has declined. It’s a good time to decide if you should sell actively managed funds you may hold in your taxable account. You’d sell and take the net proceeds and buy peer index funds for a better long-term return. You have a number of factors to consider, but the recent decline means gains taxes – the big factor that sticks in the mind of most investors – are less of an issue now. This post examines a different factor. I do my best to answer the question, “What is the penalty in lower annual return from the taxes you pay on capital gains distributions from actively managed funds?” In summary, I calculate the penalty is small, about .2 percentage point penalty in return. I differ with the +one percentage point penalty that Morningstar (M*) calculates.


Here’s my list of the factors you’d think about in deciding to sell or hang on to an actively managed fund. This post examines the last one I list here. I’ll examine how I would prioritize funds to sell (#2a and b) next week and give you the math for #1 the following week.


I want to knock this last factor off the list. Morningstar’s calculation of this cost is high and almost makes the decision a slam dunk: SELL, SELL, SELL actively managed funds in your taxable account and buy replacement peer index funds. I wanted to understand: is this cost really as high as M* states?


You find M*’s calculation of tax cost penalty of distributions – the penalty in lower after tax return as compared to pre-tax return – on the Price page for any fund. You really want to compare the tax penalty of your actively managed fund to that of its peer index fund. for example, M* shows the tax-cost penalty for Fidelity Contrafund (FCNTX), the largest actively managed fund in the US, is about 1.5 percentage points per year while the tax-cost penalty of its peer index fund, VIGAX, is about .3 percentage points per year.


The 1.2 percentage point difference is a HUGE penalty. It’s nearly 15% of the expected, 7.1% real return rate for stocks (1.15/7.1). The compound difference in returns adds up to a BIG HIT in dollars in your hands when you ultimately sell for your spending. Is it really that big?


== Total Pre-Tax Return: Dividends reinvested + price change ==


We need to start here to get our bearings. The total pre-tax return on a security you hold includes 1) dividends that you reinvest on the day you receive them and 2) capital appreciation from the change in price.


Example: you buy 100 shares of a mutual fund at $20 per share = $2,000. In the middle of the year you receive $40 dividends that you immediately reinvest when the price has risen to $21/share. You buy 1.905 shares ($40/$21). (You can look at your monthly brokerage statement and see that dividends you receive are reinvested the day you receive them.) You now own 101.905 shares. At the end of the year, price has risen to $22 per share. The total value of your holding is now $2,242; your gain in the year is $242. Your total return rate is 12.1% ($242/$2,000): you earned 10% from price; 2% from dividends; and .1% from the price gain from when you received the dividend.


== All funds (and ETFs) have lower after-tax return ==


When you hold a security in your taxable account, your after-tax return is always less than the stated pre-tax return for that security. You pay taxes on dividends; you’re reinvesting, in effect, less of each dividend. You lose a little growth in your investment from paying taxes earlier than you otherwise would. You also pay gains tax when you ultimately sell a stock mutual fund or ETF to get the cash you need for spending.


== Index funds distribute ~solely dividends ==


Index funds solely (well, almost solely) pay out the dividends they collect from the securities they hold, and you pay taxes on your share that they report to you at the end of each year. An index fund like VTSAX rarely sells the securities it owns. M* states VTSAX has 3% annual portfolio turnover meaning it hold on to its typical a security for 33 years. It’s only paid dividends for the last 19 years and no capital gains distributions.


== Gains distributions: the added tax penalty


Why do actively managed funds generate gains distributions while index funds don’t? Actively managed funds are constantly seeking to improve their portfolio to beat other actively managed funds and to overcome their inherent cost disadvantage to beat the market. M* states FCNTX has portfolio turnover of 26%; you could think of this as completely changing the stocks it holds every four years.


When a fund sells securities to buy others it thinks are better, it records the net gain from all its transactions in a year and then reports these capital gains to you – distributes them to you – and you pay the tax on these gains. This chart shows that FCNTX annually distributes about 5% of the share value as gains distributions.


Your total return does not change from these distributions. You are simply paying taxes earlier than you would otherwise. The impact of paying these taxes earlier is not straightforward. You’re paying added taxes now. Your cost basis of your investment increases. You’ll report less gain and pay less tax when you finally sell to get the cash for your spending.


== A spreadsheet tells the story: 10 years ==


I could not follow the math that M* uses to calculate the return penalty from capital gains distributions. I found I needed to build this detailed spreadsheet to understand the tax effect of dividends and capital gains distributions over the whole cycle of ownership and final sale. I think my approach is the correct way to look at this. In summary I calculate .15 percentage point per year return penalty from owning the typical actively managed. That’s roughly one-eighth the penalty that M* would calculate.


I describe the key assumptions at the top of the spreadsheet. The basic assumption is 7% real rate of return per year, and I ignore the effect of inflation. The result for each year assumes you held your investment for those number of years and sold it at the end of the year. Here’s the comparison of returns for an investment held ten years. The key comparison is Case 3 vs. Base Case 2. That’s the .15 percentage point difference per year.


Case 1. This case has the 7% real return per year solely from price appreciation. This is best possible case of net return after taxes. No dividends. No capital gains distributions. You don’t lose any growth of your investment from paying on-going taxes. Your investment compounds at a 7% rate. You only pay tax on the final sale to get cash you want for your spending.


Base Case 2: This case has the 7% return as 2% from annual the dividend rate and 5% from price appreciation. I make this the Base Case, since the assumption in Case 1 of no dividends is not realistic. The average dividend rate for all stocks is about 2%. You can think of this investment as a broad-based, stock index fund which has no capital gains distribution just like VTSAX. After selling at the end of ten years, the after-tax return is 5.93% per year.


Case 3: This is the same dividend rate as the Base Case with added 4% capital gains distributions each year. The annual 7% pre-tax return is the same, but the annual taxes you pay triple: tax on 2% dividends + 4% gains distributions. You lose more growth potential from the greater taxes paid but your cost basis increases more. After selling at the end of ten years, the after-tax return is 5.78% per year. This case has lower after tax return of .15 percentage point per year after ten years as compared to the base case. That’s the typical, added tax cost of capital gains distributions.


Conclusion: This is a good time to consider selling actively managed funds that you may have held for years in your taxable account. You have a number of things to consider in this decision, and one is the penalty you pay in lower after-tax return from the on-going taxes you pay on capital gains distributions from actively managed funds. Morningstar calculates this cost as roughly one percentage point per year in the example I used in this post – and much more than this for some funds. That’s BIG. That would tilt you to sell, sell, sell your actively managed funds and replace them with index funds. I calculate this penalty in return is much smaller – about .15 percentage point cost per year. That’s a minor consideration in your decision to sell an actively managed fund.

Should you skip taking your RMD this year?

Surprise – or at least it’s a surprise to me – the CARES Act gives us older retirees the option to skip RMD this year. This post addresses whether or not you should do that. My conclusion: most retirees have to take more than their RMD for their spending, so this has little effect. Those who don’t have to take more than RMD for their spending don’t gain much by not taking it.


== Meaningless for 80% of retirees? ==


The IRS reports that in a normal year 80% of retirees withdraw more than RMD from their retirement accounts. I’ll make the sweeping generalization that these folks do that because they need the cash proceeds for their spending. Otherwise they’d only take RMD and get the balance of their needs by selling taxable securities at lower tax cost.


This provision in the Act sounds good but isn’t any real help to this 80% of retirees, and these are the folks that actually need greatest help when stocks have tanked. These folks, like all of us, help themselves most by disproportionately selling bonds – now near their all-time high – to get the cash they want for spending.


== No big deal for the other 20% ==


Just 20% of retirees take only RMD. Patti and I fall in this group. We’re fortunate to have taxable financial assets. Our plan is to always take our annual Safe Spending Amount (SSA; see Chapter 2, Nest Egg Care). SSA is always greater than RMD. That means in a normal year 1) we sell securities in our retirement account for our spending; 2) we then get the balance from the lowest cost source of added cash – sale of taxable securities. (This may not be a normal year. Last week I described different steps I’ve taken for our RMD.)


Patti and I could completely avoid RMD in 2020. We have the option of getting the cash we need for our spending by solely selling taxable securities. We’d lower our tax bill and keep about 20% more from our nest egg for spending. I’ve described this before, but here it is again. Here’s an example:


• Option #1: Assume our RMD is $50,000; we sell securities for RMD in December this year; 2) assume all of that would all be in the 22% marginal tax bracket. We’d incur $11,000 income tax on that $50,000. We’d net $39,000 after tax.


• Option #2: Skip RMD but sell $50,000 of securities from our taxable account in securities at about 7% effective tax rate or $3,600 tax. We’d net $46,400. That’s $7,400 or about 19% more after tax to spend in 2021 ($7,400/$39,000).


I’ve mentioned this in a previous post: that sounds terrific, but this is really a tax deferral. I’m not escaping paying $11,000 in tax on withdrawals from our IRAs. Selling taxable securities in 2020 gives us more to spend but I’m using up our low-tax source. We’ll wind up having to use our high-tax source – our retirement accounts – for our spending later. Even if we leave it to our heirs, they’ll pay tax, and I assume they’ll pay in the 22% marginal tax bracket.


That added $7,400 doesn’t have much meaning to me now. It certainly isn’t going to add to our FUN. Our biggest discretionary FUN expense is travel, and it looks like that is off the board until Patti and I are vaccinated.


I am more concerned about the potential of paying higher taxes than I am about what little FUN I get from the added $7,400. I can see that high tax-day coming because Patti and I have proportionately less and less in our taxable account as the years roll by. That’s because each year we take out a greater proportion for our SSA from our taxable account. You see in this example that Taxable was 25% of the total before I withdrew our first SSA, and it was 23% of the total after I withdrew it. This pattern repeats year after year for us.


I have a minimum amount I want to always have in our taxable account. I can see that we’ll hit that point in a few years. That means I’ll have to take more than RMD from our retirement accounts. That would be very unappealing to me if I ever stumble across the amount of income that triggers higher Medicare Premiums – $2,000 a tripwire for the two of us – and a higher marginal tax rate that I (really Patti after I have died) could otherwise avoid.


Conclusion: The CARES Act lets us older retirees skip taking RMD in 2020. I don’t think this provision means that much to any of us. This really doesn’t help the 80% of folks who take more than RMD. They’ll have to withdraw from their IRA because they need that cash for spending. The 20% who can just take RMD will likely do that for 2020, too. All retirees will want to sell bonds to get cash for their spending. None of us want to sell ­deeply depressed stocks for that.

How much are you required to sell in your retirement accounts for your RMD?

You don’t HAVE to sell ANYTHING – stocks or bonds – in your Traditional retirement accounts when you take your RMD or any other withdrawal from your Traditional retirement accounts. These two decisions are separate: 1) How to take your RMD and 2) What securities you sell to get cash for your spending ­– including taxes. I bet most of us older retirees routinely sell securities in our Traditional retirement accounts to get cash, withhold taxes, and then transfer the net cash to our Taxable account for our spending: we think we must sell from our Traditional IRAs to get cash for spending. That’s not correct. This purpose of this post is to suggest a different way to think about how to take your RMD: transfer securities to your Taxable account and then decide what to sell to get cash for your spending.


== Option 1: Sell securities equal to RMD ==


The usual way I’d guess all of us older retirees take our RMD leads us to the mistaken idea that we have to sell securities from our Traditional retirement accounts. Here’s the process for a normal year for Patti and me. Each of the last five years have been normal, and if I don’t think clearly it becomes the way I think I must use to take RMD.


• Based on returns for our performance year ending November 30, I calculate our Safe Spending Amount (SSA) for the upcoming calendar year. (See Chapter 2, Nest Egg Care and this post for our most recent calculation.) Our SSA will always be more than our RMD. RMD is a big portion of our total SSA, though.


• I take our RMD that next week, the first in December. I normally sell securities in our Traditional IRAs, withhold ~20% for taxes, and transfer the net amount of cash to our Taxable account. (Patti and I both have Traditional retirement accounts and are subject to RMD.)


• I then figure out where to get the balance of our SSA. Arranged from lowest tax cost to highest, I can choose to 1) withdraw from my Roth (Patti doesn’t have a Roth), 2) sell taxable securities, or 3) take more from our Traditional IRAs.


== Option 2: Transfer securities for your RMD. Then sell. ==


This year may not be a normal year. Let’s assume the following: stocks have cratered over the 12 months ending November 30; bonds have also declined. I decide that I don’t want to sell ANY stocks or bonds from our Traditional IRA in December. I want to give stocks and bonds a year to recover. I want to use cash from our Reserve in our taxable account for our spending. (See Chapter 7, NEC). (I described in this post that I now have enough cash in our taxable account to do that.)


How do I take our RMD? I transfer shares of securities from our Traditional IRAs to our Taxable account. I’ve sold nothing: in my case I can use Fidelity’s web site to transfer a dollar amount of securities to our taxable account and withhold nothing for taxes. Fidelity calculates the shares that fulfill the dollar transfer I request based on the end-of-day price. Overnight those shares disappear from our IRA accounts and appear in our taxable account.


== Took most of our 2019 RMD now ==


Two weeks ago I took most – about 80% – of our 2019 RMD by transferring securities from our Traditional IRA accounts. I would usually do this the first week of December. Why would I do this now?


• I want lower RMD over time. I want less in Traditional IRA. Stocks were down. At lower price/share, I am transferring a bigger portion of shares for my total dollars of RMD.


• I want more dollars in my Taxable account. I want more of a lower tax-cost source of cash for spending. I want to delay or perhaps totally avoid having to withdraw more than RMD from our Traditional retirement for spending, since those withdrawals have the highest tax cost.


I left some – about 20% – RMD that I have to take in December. I know I should withhold ~20% of total RMD for taxes. I could pay estimated taxes now on RMD; I’d use EFTPS to make that simple. But I’d rather withhold those taxes on that final slice of RMD I will take in December. I have cash now in our Traditional accounts to do that. That means that final withdrawal will be nearly 100% taxes withheld.


Conclusion. Don’t go on autopilot and think that you are forced to sell securities from your Traditional retirement account for your RMD. Think of these steps first:


1. Take your RMD by transferring securities from your Traditional IRA accounts to your taxable accounts


2. Then figure out what you have to sell for your gross spending, which includes estimated taxes.


In a normal year, this will strike you as unnecessary. You’ll decide just sell securities in your retirement accounts, withhold taxes, and then transfer the balance. But don’t make this the default thought process every year: don’t automatically think you have to sell securities from your retirement accounts for your RMD.

How do you look at your portfolio now?

This has been another stressful week. I can’t break the habit of looking at my portfolio, but I think I’ve been able to narrow what I look at. There’s a big part of my portfolio I don’t want to look at very often: we all know what that is. I play a number of mind games to look at my portfolio differently. Here’s a mind game I play every December. And this is my newest. I want to put the blinders on and just look at our insurance: cash and bonds. This is a mind game, a trick. But we need all the tricks we can come up with to stay calm at times like this. The purpose of this post is to describe this mind game.


== Bonds are Insurance ==.


I’ve said this in a number of posts, but it’s always worth restating. I never bore of drilling this deeper and deeper into my head: we own bonds as insurance against disastrous declines in stocks. That’s it. We sell bonds, not stocks, when stocks have cratered. Bonds may decline, but they decline MUCH LESS when stocks crater. This table shows the ten worst calendar-year returns for stocks since 1926. Bonds always were better than stocks in all those years and averaged 27 percentage points better. Bonds are insurance.


Here it is this year to date. Same thing. Bonds are ~23 percentage points better than stocks. Bonds are insurance. Get it?


== I moved some bonds to cash ==


I improved the quality of our insurance two weeks ago. Bonds were at an all-time high. I locked in the price for bonds that I might want to sell in December. That’s the time of year I get our spending for the upcoming calendar year – 2021 – into cash. In hindsight, my sell price of $53.99 looks good. The price now is about 9% lower. That decline is been nothing like the fall for stocks. It’s still a good time to sell bonds, in my opinion.


== I want to only look at our insurance ==


This is my newest mind game: I just want to reinforce, restate, and focus on my insurance at times like this. I want don’t want to think about stocks. How much Cash + Bonds do I have? How long will my insurance carry me?


Our money is at Fidelity. Fidelity recently changed the first page I see after I log in. The display gives me the option of quickly displaying our total portfolio by Account position – meaning by security.


I make that choice on the display above and I see the long list of positions by account. I can go down quickly enter the totals for cash and for bonds for each account on a spreadsheet that I display below. (I’ve blacked out our actual $$$ figures.) I want to do this quickly so I am not tempted to look and make a similar spreadsheet for stocks. That’s last thing I want to do. My spreadsheet adds the totals for cash and bonds. I can enter the total for each date, and I can track that over time.


My sheet shows we have eight years of spending in Cash + Bonds, and about three of those years are in cash. To get to the number of years, I divided the total by a bit less than Safe Spending Amount that I calculated last December. I’m not being stingy. The amount includes lots of discretionary travel, and I’m not sure when I think that is coming back. But I now know the number years I have before we’ve totally run out of cash and bonds and MUST sell stocks. Eight and more if we spend less.


That would mean I’ve totally depleted our off-the-top Reserve (Nest Egg Care, Chapters 1 and 7) and preferentially sold ALL our bonds in our Investment Portfolio (Chapter 1). The only thing we have left is stocks. That is DRASTIC, but with those assumptions, I know we can weather this storm.


Conclusion. We should look at our portfolio in a number of ways that help isolate our brains from wild swings in our portfolio value. We need to pull out all the tricks at times like these. My latest mind game is to just look at the cash and bonds. I want to reinforce in my brain that the total is our insurance. I divide the total of cash and bonds by our approximate annual spending. That tells me how many years we could wait before we had to sell stocks. It’s many. If you’ve followed a plan in Nest Egg Care, you have many years before you’d have to sell stocks.

You’re taking this killer seriously, right?

I hate reading articles that folks think COVID-19 is a hoax or is overblown. Or seeing those images of hundreds on the Georgia beaches. This article says a “poll this week found the percentage of those taking the threat of coronavirus had actually declined since February [for a segment of those along the political spectrum].” How can this be? This is a killer. It wants to kill us older folks in particular. This will not be a 15-day inconvenience that will keep us safe. I’m thinking this will last for over a year for us older folks. We will not truly be safe until we get a vaccine that protects us. The purpose of this post is to link to a good article I found and some other web sites.


Patti and I are being super cautious. I heard this from Sanjay Gupta on CNN, and we follow this advice: act as if we already have the virus and didn’t want to give it to someone else. The restaurants in Florida are still open; tables are spaced further apart. But if you acted as if you already had it and did not want to risk giving it to someone else, why would you ever eat out?


== Article I like ==


I like this article. David Gorski is full-time cancer surgeon and is an amazing blogger. This is cram full of information. You clearly understand from this that our enemy wants to kill us older folks. This is very different from seasonal flu and other pandemics which killed older folks at a far lower rate. Here are two graphs: the blue line in the bottom graph is the one that wants to kill us now.


== Why didn’t I think of this? ==


I should have thought this through a lot earlier: how does the seasonal flu start with one person and grow to 40 million total just in the US? And 40 million is after a large part have been vaccinated and others probably had some immunity before the vaccine. It’s the power of compound growth. Exponential growth. I should have thought far earlier: this has no immunity; AT LEAST 40 million will get it; and at least ten times more will die because it’s “ten times more lethal.” This is a good presentation on exponential growth.


== Information sources I like ==


Here are the three I have on my Favorites bar on my computer:


I like this New York Times web site. The information is in a very clear format. I also added it to my Home Screen on my iPhone. It’s easier to read there than the other two. I particularly like the chart below. You get a quick visualization of the trend in new cases by country. You can see the US crossed ten new cases per day later than the others on this display; this simply may be due to the lack of testing. You can see how the trend is headed down in China and South Korea. China actually had no new domestic cases on Wednesday.


I’ve bookmarked two more sites on my desktop computer: the Johns-Hopkins dashboard, which is not easy to view on my iPhone but is very up to date, and the WHO daily situation report. Every time I click on the Johns-Hopkins site or refresh the screen after a few minutes, the case count increases.


Conclusion: I assume I’m stating the obvious to you, but it’s worth repeating. We older folks are the prime killing target for this virus. We have to take extra care and likely will have to do that for many months. You can find good articles that tell the story and give a solid understanding of trends. Please stay super safe.

Can you save a life today?

Patti and I are hunkered down in Pittsburgh. I assume you are hunkered, too. This is a National Emergency like no other I’ve witnessed in my lifetime. This is only the second National Emergency related to stopping a virus killer, and this killer is a far more efficient killing machine than the prior one – H1N1 in 2009. Patti found this article yesterday. The purpose of this post is to pass this on. I think it is EXCELLENT as to why we should take NO HALF MEASURES. We have to SLOW THIS KILLER DOWN. Be happy to hunker. You may be saving your life and the lives of others.


When I read this yesterday, it jumped out to me that we were twiddling our thumbs. By 6 PM it was clear that governors and mayors had gotten the message. At 8 PM our governor announced all restaurants are closed in our county that encompasses Pittsburgh. Our county executive asked all non-essential businesses to close for 14 days. I had a business appointment this afternoon, and the owner texted me at 10:30 last night to cancel the meeting. Good for her.


These actions are consistent with the idea that we should act as if it will be the worst, and then adjust when you find it isn’t the worst. That’s the exact thinking behind Nest Egg Care.


My concern would be: Are we really acting as if it will be the worst? Are these strong enough actions? Should we be on total lockdown like Italy or Spain? Should all non-essential businesses be required to close now?


== What can we do? ==


We’re going to stay hunkered for at least two weeks.


We will sit out the decline in our portfolio – stocks are down about 8% today. Our economy will suffer – we likely will be in a recession soon if we aren’t in one now. But all nesteggers have the capacity to weather this storm. We all have enough cash and bonds such that we don’t have to sell stocks for many months, even years.


Patti and I texted Cindy who would normally come Friday to clean. We told her not to come, but I mailed her the normal check.


We’re going to eat more take-out than normal, I think. We have plenty to eat here, but I want to support our local restaurants and workers. Folks who have no savings and live paycheck to paycheck will really suffer. I don’t how know will they buy food and pay bills when they have no work. In this National Emergency, how will we put money in their hands?


Conclusion: This is a National Emergency like no other we’ve witnessed in our lifetimes. We all have to pull out all the stops to SLOW DOWN and IDEALLY STOP THIS KILLER. Our economy will suffer. Our portfolios will decline. We nesteggers can ride this out. We are far better off than the folks who have no savings and live paycheck to paycheck. They will really suffer. I haven’t figured out how best to help them.