All posts by Tom Canfield

How do I best use my Roth account during retirement?

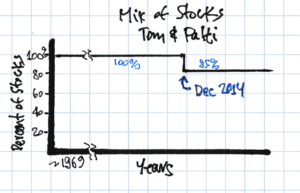
When Patti and I officially started our Nest Egg Care retirement plan in December 2014, I had no Roth IRA. All our retirement accounts were Traditional IRA, and most of our money was in retirement accounts. I posted here and here about the importance of Roth IRAs. I converted some of my Traditional IRA to Roth in 2018, 2019, and 2020. Our total in Roth is small relative to the total if our retirement accounts – less than 5% of our total – but I see Roth as a valuable tool to avoid taxes that I would otherwise pay. I described my thinking on using Roth just in May, but this post links more clearly to my tax planning of three weeks ago: it’s a clearer description of when to withdraw from Roth to get most bang for your buck – more tax dollars saved relative to the taxes you paid when you contributed to your Roth.


== Review: why convert Traditional to Roth? ==


You incur no cost when you convert from Traditional IRA to Roth – Traditional or Roth result in the exact same after-tax dollars to spend in the future. Yes, you pay taxes at your marginal rate in the year you convert, but you are avoiding the same (or more) marginal taxes in a future year. Both have the same benefit of tax-free growth, and if you use Roth to save the same marginal taxes that you paid when you contribute, you wind up with the same after tax proceeds.


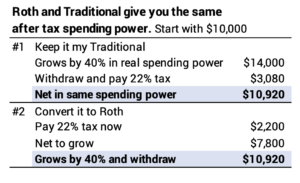
Roth gives you the opportunity to avoid higher marginal taxes that you would pay in the future had you not converted. You can get more than you paid.


Example: each year I have to pick my sources for our Safe Spending Amount (SSA; Chapter 2, Nest Egg Care). I described this in the post three weeks ago. Our age-appropriate Safe Spending Rate (SSR%, also Chapter 2) is always greater than our RMD percentage. (Patti and are both subject to RMD.) Therefore, our SSA is always greater than RMD. Each year I withdraw more for our spending from our Traditional IRAs than our RMD total.


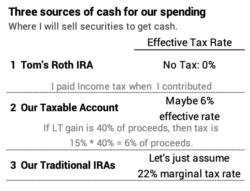
Let’s assume I paid 22% marginal tax on the amounts converted. I breakeven – I wind up with the SAME after-tax dollars to spend – if I use Roth to replace withdrawals from our traditional IRAs that would be taxed at 22%.


I come out AHEAD with Roth – I gain after-tax dollars to spend – if I can use my Roth for spending and avoid a tax that I would pay if I used another source for our spending. I potentially avoid two taxes by planning out our Adjusted Gross Income and taxable ordinary income, like I did three weeks ago.


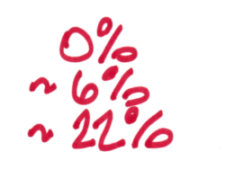
• I gain after tax dollars if I can use Roth to get under a tripwire of total income – Adjusted Gross Income – that triggers an increase in Medicare Premiums. (I consider premium increases as added taxes.) This is clearly the most important use of Roth: I can save an incremental $1,700 by using, as an example, $10,000 of Roth: I get an immediate 17% incremental return.


Our Medicare Premiums are deducted from our Social Security benefits. $1 of income above the first tripwire costs us $1,700 and others tripwires cost much more. I need to estimate how close I am to a tripwire every year. Because the tripwires don’t automatically adjust with inflation; I’m being pushed closer to a tripwire with no real increase in taxable income. This is the first thing I looked at when I did my draft tax plan for 2021 three weeks ago. The tripwires are spaced about every $50,000 of total income for married, joint filers and about every $25,000 for single filers. This post shows the Medicare tripwires for 2021.


• I come out AHEAD when I use Roth if we (or Patti or I) would ever be in the 24% marginal tax bracket. I paid 22% marginal tax, and I come out ahead if I can avoid falling into the 24% marginal tax bracket. This is an incremental 2% benefit, but I should take advantage of it assuming I will still have enough remaining to avoid a tripwire for increased Medicare premiums.


== Roth is more important when there is one of us ==


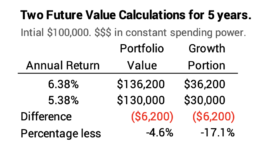
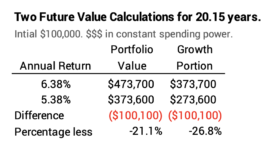
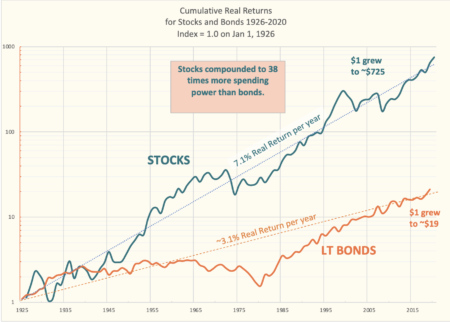
Taxes change when it’s just a single taxpayer and no longer joint, married taxpayers. It’s highly probable that the taxable income of the survivor of the two of us will crawl into the 24% marginal bracket. And the 32% marginal bracket is not out of the question for some retirees if the survivor lives long enough and if returns for stock and bonds track close to their expected return rates. See here.


Why are taxes higher? The marginal tax brackets for the survivor – single taxpayer – are half that for married, joint filers. Yet, the single tax payer will record the same real increases greater portfolio value as if both were alive; that leads to greater real amount of spending power subject to RMD; and RMD percentages increase with age.


This gets hairy, and each of us needs to figure out if we want to spend the time to keep track of this. I do like to keep track, since I think over time I’ll “make” $1,000s by spending a few hours each year to make best use of my Roth.


== An example ==


Here’s an example of how taxes and Medicare tripwires can change: assume a couple, Herb and Wendy, have total ordinary taxable income of ~$105,000. They pay total tax of $14,700. About $15,000 of ordinary taxable income is taxed in the marginal 22% bracket. They aren’t close to a Medicare tripwire that would increase the premium.


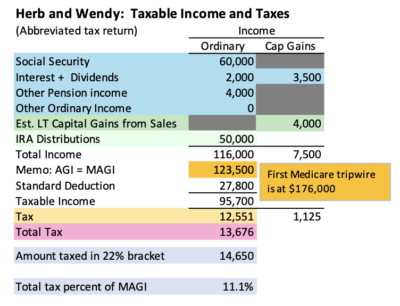
Let’s assume Herb dies. Wendy will have lower total income: she’ll lose the lower Social Security benefit, as an example. She would have about $20,000 less taxable ordinary income in this example, but would pay $16,400 in tax – about 25% more than if Herb was still alive. About $50,000 of income is taxed at the 22% or 24% marginal tax rate. She also would cross a Medicare tripwire that would cost $860.


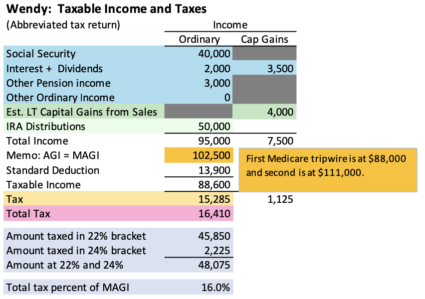
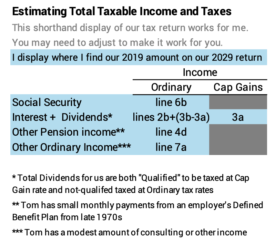
This PDF shows greater detail than these two images.


== My annual checklist and story to Patti ==


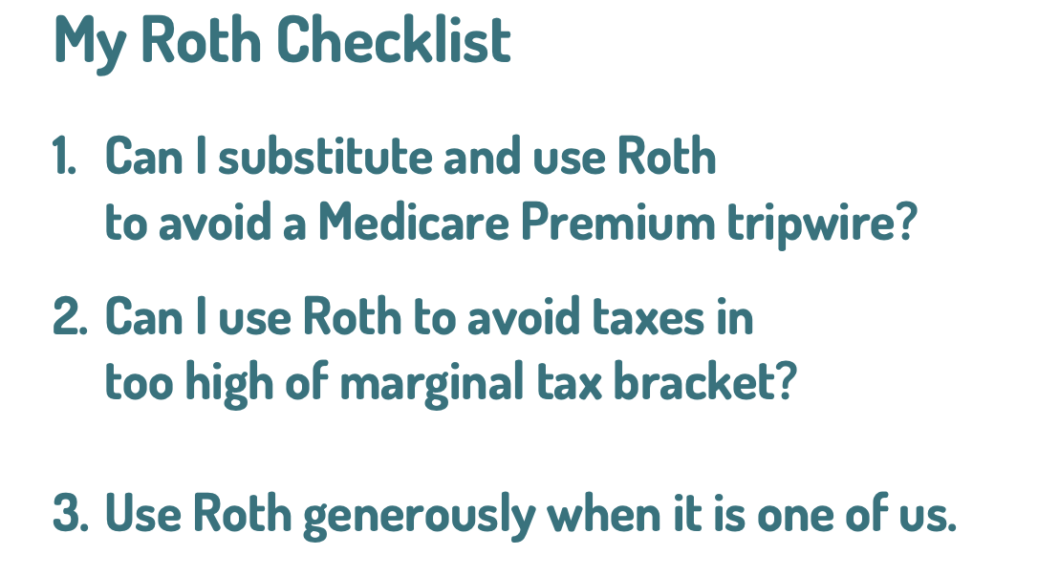
It’s important to use your Roth wisely. Here is my checklist when I do my draft tax plan each August. I redo this in the first week of December, when I know exactly the tax implications of our SSA for the upcoming year. I will be much closer to our full year tax return. I ask these two questions:


1. Can I substitute Roth for Traditional this tax year to drop our Adjusted Gross Income to avoid a Medicare tripwire?


2. Can I substitute Roth for Traditional this tax year to avoid paying tax in the 24% tax bracket?


My story to Patti is this: after I’ve died, use Roth generously. Try to complete a tax plan (or have someone help) to at least avoid a Medicare tripwire EACH YEAR. Any Roth that you use if you cross into the ≥24% tax bracket is a good use of Roth.


Conclusion: I recommend you convert some Traditional IRA to Roth, being careful not to cross into a higher tax bracket when you convert. Conversion costs you noting in terms of future after-tax dollars to spend. Roth, however, gives you opportunities to avoid future taxes that you do not need to pay. You need to spend some time each year to sort this out, but the two opportunities are to 1) use your Roth for spending and not another source that records taxable income that crosses a tripwire that increases your Medicare Premiums; and 2) it is very likely that the survivor of a couple will be pushed into a higher marginal tax bracket; use Roth generously when that happens.

What changes in your financial retirement plan when a spouse dies?

What changes in your financial retirement plan and, most importantly, how is the surviving spouse’s financial well-being affected when one spouse dies? This purpose of this post is to describe the key changes as I see them. The key point is that the surviving spouse’s Safe Spending Amount (SSA; Chapter 2, Nest Egg Care [NEC]) will at least be the same as if both of you were alive. I conclude that Patti will be just fine in the future after I die.


== Expenses will decrease ==


Expenses for one will be lower than for two; that should be obvious. I estimated our routine spending in this post. If it was just one of us, the major expenses that would decline are car (sell the second car for cash; pay no annual insurance or on-going expenses), food (not an insignificant amount!), and airfares on travel. My rough estimate is that these lower expenses roughly match the effects of lower Social Security income.


== Social Security benefits will decrease ==


If both collect Social Security, and one spouse dies, the surviving spouse retains the highest benefit and foregoes the lowest benefit. Example: Patti and I both receive Social Security benefits. One is ~70% greater than the other or +60% of the total. If one of us dies, the other will retain the higher benefit and not the lower benefit: the gross Social Security benefit will decline by about 40%.


You may have other distributions from a defined benefit plan or other sources of income that will change on the death of one of you. For Patti and me, the changes would not be significant.


== SSA will not decrease ==


The Safe Spending Amount that you now pay from your nest egg for spending in a year will not decrease. Depending on which spouse dies first, it could increase.


Your SSA is your Safe Spending Rate (SSR%) times your Investment Portfolio. (See Chapter 2, NEC). SSR% is determined by the number of years you choose for ZERO CHANCE of depleting your Investment Portfolio in the face of the MOST HORRIBLE sequence of stock and bond returns in history.


Patti and I decided to use her longer life expectancy for our choice of the number of years we wanted for ZERO CHANCE of depleting our Investment Portfolio. (See Chapter 3, NEC.) That choice set our initial SSR%, and the logic of using her life expectancy sets all our future age-appropriate SSR%s. I use the appropriate SSR% in the calculation that tells me if our SSA increases in real spending power for the next spending-year or simply adjusts for inflation.


If I die first, nothing changes: Patti uses the same SSR%s that we have already scheduled for all years in the future. If Patti dies first, I’d reset the SSR% schedule based on my life expectancy: I’d use a greater SSR% than we now have scheduled.


Example: At the start of our plan in December 2014, Patti’s life expectancy was 19 years. Nineteen years for ZERO CHANCE for depleting an Investment Portfolio translates to an initial SSR% of 4.40% – $44,000 spending power per $1 million initial Investment Portfolio. (See Appendix D, NEC.) My life expectancy at the time was 14 years; that would have translated to a higher SSR%.


It’s now mid 2021, almost seven years later. We use the age-adjusted SSR% – based on Patti’s life expectancy – that I’ve laid out on my calculation sheet in this post. That was 4.85% last November 30; Patti’s life expectancy from the Social Security calculator then rounded to 15 years. I will test to see if I can use 5.05% this December; her life expectancy then rounds to 14 years.


If I die first, NOTHING CHANGES in Patti’s calculation of SSA. The age-adjusted SSR%s do not change for any future year. My retirement accounts first pass to Patti; our taxable accounts are held jointly; therefore, our total Investment Portfolio does not change. She can pay herself the same SSA that we both would have received.


If Patti dies first, then I’d use my shorter life expectancy to set a new schedule of SSR%. If Patti died now, I’d use the SSR% associated with my 11-year life expectancy for the calculation this November 30 – 5.80% (See Appendix D, NEC). It looks like our portfolio will earn far more than we withdrew for our spending last year (4.85%). That tells me that I’d use the new, greater SSR% to calculate spending for 2022. If that still holds to the end of November, my SSA for spending in 2022 would be 23% greater than if would be if it is the two of us or just Patti alive [(5.80%-5.05%)/5.05%)].


== Taxes will increase but will not damage ==


The surviving spouse will pay more total tax than the married couple. Even though the Social Security benefit declines, Patti’s total income will roughly 80% of the total for the two of us. That will result in higher taxes because higher marginal tax brackets start at half the income for a single taxpayer as for a joint, married taxpayer: more of the total is taxed at higher marginal rates. Also, the tripwires that result in increases in Medicare Premiums are half the total income as for a joint, married tax payers. 


I worked through this for Patti and me as a single taxpayer relative to us as married, joint filers and find the increased taxes are meddlesome – the surviving taxpayer will pay perhaps a couple of $1,000 in higher income tax than the two of us pay now and would cross a Medicare tripwire that the two of us do not cross. (I give a specific example in next week’s post.)


I conclude Patti clearly have enough for spending after taxes each year to enjoy the money we worked so hard to accumulate. She’s may judge that she has More-than-Enough. (See Chapters 5 and 10, NEC.)


== With planning, the survivor can lower taxes ==


If one is a stickler like I am, it is more important to take an annual snapshot of a tax plan, like I did here two weeks ago with this spreadsheet. My Roth will be more valuable to the survivor of us, because there will be more annual opportunities to avoid taxes that he/she does not need to pay: added Medicare premiums and higher marginal tax rates than we paid to contribute to Roth.


I’d likely do that annual tax planning; I like those details and finding if I can completely avoid paying a tax. Patti REALLY likes to save money, but she’s not a spreadsheet person. I think she is up to learning how to save perhaps $1,000 per year, though. That’s much more than she saves on another set of plastic food containers – that we don’t need – from The Dollar Store!


Conclusion: If you follow the plan in Nest Egg Care and you are a couple, I conclude you can be comfortable thinking that the survivor will be just fine in the future. Expenses will decline. Some income will decline – Social Security benefits are the key example. Total taxes paid on the same sources for SSA will be higher for a single taxpayer than they were for married, joint filers. But, most importantly, the Safe Spending Amount you pay yourselves now will be the same for the survivor in the future. SSA never declines; it can only get better. I am not at all concerned about Patti’s financial future if I die.

How do we meet COVID-19 requirements to enter the UK and return to the US?

This post doesn’t have anything to do with financial retirement planning, but I thought I would describe the current COVID-19 requirements to travel to the UK and to return to the US – as best as I understand them. That’s because this was the all-consuming task for Patti and me this week. We must have spent more than 10 hours to sort this out and implement the steps. We did not find a succinct description of what to do and how to meet the requirements. I’ll be shocked if this went smoothly for other passengers on our flight to the UK.


We had planned a trip in May of 2020; we try to go that time every year. It was the first trip we cancelled in 2020. Patti bought new tickets this March, soon after we’d been vaccinated. Right now, the CDC suggests not traveling to the UK because of their rate of new cases, which is very similar to ours, but we still plan to go.


I display the steps:


== Meet UK requirements before we leave ==


• Get a proper NAAT COVID test in the US within three days of departure. 0 is your departure day. Our departure day is Wednesday. We have to get tested no earlier than Sunday. We booked a test time on Sunday at a CVS MinuteClinic about a mile from us. They overnight all tests to a lab, and we will get results on Monday or Tuesday with a link to results. We’ll have to show the printed report or documentation on our phone of the negative test results before we get on our initial flight from Pittsburgh and, I assume, again on arrival in the UK.


• You need to purchase a UK approved “Day 2” test. We need to complete the test within two days of arrival: 0 is your arrival day. We arrive on Thursday. We need to complete the test by Saturday.


We needed to order this test a couple of days before our flight, since we need evidence – a Locator Reference number provided by the company that supplies the test. That number is stated on our receipt. The number is required for the UK passenger locator form we must fill out within 48 hours of departure (see below).


We used this site to find UK government approved testing companies. From the site, we picked 1) Day 2 test, 2) self swab at home, and 3) location of North East England: that’s the area where we first stay. We get a long list of providers (373!). The test kits we ordered, including next day delivery to the first place we are staying, were about £75 each – roughly $100 each. We ordered the kits six days before arrival. Our provider sent us an email as to exact time of delivery, and the place we are staying confirmed today that they have our kits.


A test kit has instructions and a return envelope for our swab. We mail that envelope in a “Priority” Royal Mail Box that is collected at the end of every day with tests delivered to testing labs the next morning. There are 35,000 in the UK. This site shows the identifying label. This site tells you the location of a nearby priority mailbox. It lists where we are staying has a priority post box or is a priority collection point.


We will get test results emailed to us within 72 hours. The NHS also gets those results. We’re assuming we will be negative, but if not, we’ll follow the instructions that I’m sure we will get in the email. If positive, I assume for now that we would have to quarantine and totally change our internal travel plans.


While new case rates are slightly higher in the UK, I think our risks are no worse than traveling in the US. As of now, 75% of all adults are fully vaccinated in the UK as compared to about 50% in the US.


• Complete a passenger locator form no earlier than 48 hours before we arrive in the UK. We arrive in the UK about 5:30 AM on a Thursday, Pittsburgh time. We must fill out the form after 5:30 AM on Tuesday.


== Meet US requirement before we return ==


We need to present a negative test for COVID before we depart. This is a “supervised” home swab test. We need to carry the correct test kit with us to the UK to use within three days of our return flight from the UK. 0 is the departure day. We leave the UK on a Monday. We need to complete the test no earlier than Friday.


The test is a BinaxNOW Ag Card home test made by Abbott. The supervision is a video-connected observation of us taking the test and then reading the result displayed on the test card. That’s with a company called eMed. We get an App for our iPhones: NAVICA. We’ll use that App when we are ready for the test and video connection to eMed. If we are negative, they’ll give each of us a digital health pass, a QR code similar to an airline boarding pass, on NAVICA. We’ll have to present passes before we board and maybe at passport control when we arrive.


We bought the test kits from eMed. The basic package has more than one kit. We’ll take two each. The test is not as accurate as an NAAT/PCR test and can have false positives. I’m sure we would use the second kit if the first test shows we are positive.


We fly Delta, which links to a form that we use to attest that we have a negative COVID-19 test. We complete that form online and print it or we can complete the form at the airport.


Conclusion: Patti and I are traveling to the UK next week. We had difficulty understanding what we had to do and by when to meet COVID-19 requirements to enter the UK and then to return to the US. This post describes the requirements and how we will complete them.

Have you started on your tax planning for 2021?

My tickler file tells me that this is the week to take my first draft cut on my tax plan for 2021. This post is to describes my steps. I get three things from this process: 1) a rough guess of our Safe Spending Amount for 2022 (SSA; see Nest Egg Care (NEC), Chapter 2); 2) an estimate total income and taxes for the year; 3) a good estimate of the net cash we will have by the end of December for our spending in 2022.


This is the second year that I’ve done this in August, and its getting easier to complete. I suggest that you spend a bit of time to sketch out your 2021 tax plan. This post is similar to my post this same week last year; I think I improved the spreadsheet you might use for your tax planning.  


It’s the same steps as last year:


Step 1. Estimate our Safe Spending Amount for 2022.

Step 2. Decide where I will sell securities to get our total SSA into cash.

Step 3. Estimate our total taxes for 2021 based on those decisions.

Step 4. Calculate the net cash we’ll have this December for spending in 2022.


In this post I ignore the wrinkle of how I handle money left over at the end of the year – our current SSA that I have not fully spent or gifted by the end of the year. We donate what is left over. I don’t throw it back into our Investment Portfolio. The math wrinkle is that I take an added Qualified Charitable Distribution or QCD for the amount we will donate. (Patti and are over age 70½ eligible for QCD.) You should always donate using QCD if eligible. You gain the full tax benefit of your donations in addition to your Standard Deduction.


Step 1: Estimate our SSA for 2022. I made a rough guess of our SSA for 2022 assuming the full year will match our portfolio return for the 8 months December 1 – July 31: that’s +16% nominal return for the year. I estimate that’s +11% real return if inflation is 5%; that’s the average annual rate for the last three months. The 11% real return means we would earn more in spending power than the 4.85% that I withdrew last December: when you earn back more than you withdrew, you always get a real increase in SSA.


I plug +16% nominal returns and my inflation assumption in the spreadsheet from this post or the one in this post. Patti and I are on track for a 10% real increase in our SSA for 2022 – and 16% nominal dollar increase. Wow. This would be the fifth increase in seven years and +45% in spending power from the start of our plan in 2015. This is getting out of hand!


Step 2. Decide where I will sell securities to get our 2022 SSA into cash. Patti and I both are subject to RMD from our IRAs. After we withdraw our RMD, we have three sources for the added amount I should take to equal our SSA. I list them in terms of least tax consequences to greatest: 1) my Roth = 0% tax; 2) sales of securities in our taxable account = roughly 6% total tax; and 3) further withdrawals from our IRAs that I’ll assume are at 22% marginal tax for this post.


Step 3. Estimate our total taxes for 2021 based on those decisions. I have to add the impact of those decisions on a pro forma tax return for 2021. My accountant sends me a PDF of my 2020 tax return, and it’s a snap to get good estimates of most all the items for my 2021 return; they don’t change much from one year to the next. The biggest source of routine income for us, other than RMD, is the taxable portion of Social Security Benefits; that will be 1.3% more than last year.


When I look at the result – I focus on MAGI – I see I don’t need to tweak my initial decisions: I am not near a Medicare tripwire that would tell me that I should withdraw from my Roth to avoid it.


Step 4. Calculate the net cash will have for spending in 2022. That’s the gross sales of securities less the amount I’ll withhold in taxes in the distribution I’ll take from our IRAs the first week of December.


I pay some estimated tax in the year using EFTPS, but I pay about 75% of our total tax bill in that withholding. I’ve gotten free use of those tax dollars for roughly a whole year; I earned more than $2,000 on the free use this year.


== I always pay more than the absolute minimum taxes ==


I don’t minimize taxes each year. If I had done that, I would obviously have first DEPLETED my Roth account; then I would have DEPLETED our taxable holdings, and I’d derive all our spending from our IRAs: I’d take our RMD and then take more from our IRAs. I would have paid much lower taxes in early years of retirement and much higher taxes when I’ve depleted the first two. And I could be, at some point, in an uncomfortably high marginal tax bracket for IRA distributions, and that would defeat the whole benefit of tax-free growth in retirement accounts.


I try to keep about three or four years of spending in taxable securities + my Roth. I’ve had to work to keep that level: I refinanced our mortgage and took a bigger one to get cash out to increase our assets in our taxable account. I want to that level of three or four years now, and the excellent returns over the last three years have given me room to sell chunks each year, but I still withdraw more from our IRAs than just RMD for our spending. I’m more comfortable doing that – paying 22% marginal tax on some of our spending and not 6% or 0% – to preserve a level of lower tax-cost sources.


In my mind, those lower tax-cost sources are a form of insurance that will help preserve the health of our portfolio in times of stress. The biggest stress relief for our portfolio is to use out Reserve for spending and skip a whole year of withdrawals from our Investment Portfolio. Keeping low tax-cost sources is similar. I could decide to withdraw less than our SSA; if I use more of the sources with low tax cost and less from our IRAs, I’d have much less impact on the net that we can spend.


I’m very stingy on withdrawing from my Roth. I already paid income tax on the amount I contributed. I want to get the best tax benefit when I withdraw from it for our spending. The painful tax or cost Patti and I could incur is a tripwire that increase Medicare Premiums; those premiums are deducted from our gross Social Security benefits, and the amount deducted increases if we cross specific levels of income (Modified Adjusted Gross Income or MAGI). The first tripwire costs us $1,700 and others are more expensive. I get biggest bang when I use Roth as a source for our spending and lower our total income to avoid crossing a Medicare tripwire. (A Roth distribution as not part of MAGI.)


== What I now know ==


1. I have a reasonable estimate of our gross, pre-tax SSA for 2022: that could be +15% nominal increase!


2. I do not need to withdraw from my Roth this year: I am not near a Medicare tripwire that I can avoid.


3. I know the total amount of taxes to withhold from the distribution I will take from our IRAs the first week in December.


4. I have a reasonable estimate of the cash I will have in December for our spending in 2022. I know our monthly paycheck that I transfer from our Fidelity account to our checking account could be 15% more than our current pay.


Conclusion: We all should spend time thinking through our tax plan for 2021. We all have choices as to what securities we will sell to get the cash for our spending. The wrong decisions could result in added taxes that we don’t need to pay. This post discusses the steps I take develop our draft plan.


I draft my tax plan for the current calendar year in the first week of August. That’s 8 months into our calculation year which runs December 1 – November 30. I now have a reasonable expectation of 15% increase in our Safe Spending Amount for 2022; I ~know what I should withhold for taxes when I take our withdrawal from our IRAs in December; our net pay for 2020 may increase by 15%.

Will we really be able to travel across the pond?

Patti and I traveled this week to Denver (Patti’s sister and family) and to St. Louis (my brother and his wife and family of Patti’s brother who died last spring). So, this post is far lighter than normal. The good news this week for Patti and me is that it finally looks as if we can take on our almost-annual trip to England. We’ve had that trip planned for late August-early September. The UK will now let in vaccinated travelers from the US without having to quarantine. The purpose of this post is to remind ourselves: the sands of time are running for us retirees, and we should spend to make sure we enjoy the time we have left.


Patti and I are ticking off a number of ways to be happier that I described in this post: 1) we’re spending our money on an experience that we know we will enjoy;  2) it’s a special treat since we haven’t been able to travel abroad for the last year and a half; 3) we’ve prepaid at least half the total that we will spend: the airfare and our lodging for at least one of our stays; I’ll soon buy advance-fare train tickets at half price; that will feel good, and in total it will feel like we will be spending very little when we are there.


I’ll go through my checklist of final actions. I’ve found in the past that we need dinner reservations at several of the spots we’ve liked. I’ll be thinking of past meals we’ve had there and anticipating eating there again. Anticipation is a bit of happiness.


We need to be sure of the final requirements for entry to the UK: I don’t think that gets updated until Monday. I’m not clear on the procedures to get back into the US: we may have to test for COVID a couple of days before we return. And I don’t know what that might mean if we have an asymptomatic case before our return flight. As the chart shows, new cases in the UK shot straight up and but have fallen dramatically.


Source: https://ourworldindata.org


Conclusion. We retirees should spend money to Enjoy. Now. Most all the discretionary money Patti and I spend is on travel, and it looks like we might be getting back to our regular pattern of one or two trips abroad each year. As of this coming Monday, the requirements to get to the UK are not constraining. Patti and I are hoping we can take the trip we have planned for the end of August-early September.  

What mix of stocks should you have before retirement?

How do you set your mix of stocks and bonds before the start date of your retirement? Patti and I officially started our retirement plan in December 2014. That was the first year we took a full withdrawal from our nest egg for our spending in 2015. I decided on a mix of 85% stocks during retirement. (I recommend you decide on a range between 75% and 85%, and you’ll find my logic in Chapter 8, Nest Egg Care [NEC].) How should we have been invested prior to that date? The purpose of this post is to describe my thinking on your decision on your mix of stocks vs. bonds prior to retirement. My basic conclusion: your retirement nest egg should be invested 100% in stocks for most all years prior to retirement.


== How to Invest ==


Let’s knock off this checklist:


You’ll invest in financial assets – stocks and bonds. Stocks and bonds have a long record of real growth – returns over time that are greater than inflation. Stocks return about 7% per year and bonds return about 2.6%. (I average the real returns for long-term and intermediate return bonds.) Non-financial assets, real estate and commodities as examples, are components of the calculation of inflation. They keep pace with inflation; they don’t outdistance it; in general, they have no or very low real return over time.


• You’ll invest in index funds. You MUST be a low-cost investor in retirement, and you must be a low-cost investor before retirement. The only way to reliably keep most all the market delivers is to invest in index funds. Patti and I predictably keep +99% of what the market delivers to investors before consideration of costs; the weighted average of our investing costs is 0.05%.


Your mix of stocks will be greater before retirement than in retirement. I’d work backwards from your decision on mix of stocks and bonds in retirement. In Nest Egg Care I picked 85% for Patti and me. That means I should have owned more than 85% stocks in all the years before our first full withdrawal for spending. If you pick 75% as your mix for your retirement plan, you should own more than 75% stocks.


== Retirement >10 years from now = 100% stocks ==


I argue that you should be 100% stocks in all but the last ten years before the start of your retirement plan. That mix gives you by far the best odds of having more throughout the period of full withdrawals from your nest egg for your spending in retirement.


An example: The official start of our retirement plan was December 2014; that was the first date we took a full withdrawal – our Safe Spending Amount – for spending in an upcoming year. (See Chapter 2, NEC.) Following the recommendation in this post, that would have meant that I should have been 100% stocks up to December 2004. (Patti and I were.) I could then transition to the mix at the start of our retirement plan that I get from my decisions from Nest Egg Care: 85%. (See Chapter 8.)


== The odds of MORE in 10-years ==


How do I judge that you should be 100% in stocks if you are 10 or more years before the start of your retirement plan? I build the historical sequences of 10-year returns for stocks and for bonds and compare the two. Here are questions I would ask:


1) At the average of the sequences of returns, how much more might you expect from stocks relative to bonds? Is this a meaningful difference?


2) Stocks and bonds are variable in return. Your portfolio won’t always grow in real spending power in 10 years. How often do stocks return more than you started with over 10 years? Is that more or less frequent than bonds?


3) Since stocks are more variable in return, we’d expect 10-year periods where bonds outperform stocks. How often did bonds do better than stocks? How much better?


== 75 sequences of 10-year returns ==


I compiled the cumulative increase in real spending power for 75 10-year return periods ending in the years 1945 – 2020. That means I’m not including the unusual returns for stocks and bonds 1926-1935, basically during the Great Depression. I used Intermediate bonds in the comparison; I think that’s the closest to what we hold when we invest in bonds. I used the year-by-year return data that for this graph of cumulative real returns over time. I show the calculations for the increase in real spending power for all the 10-year sequences in this PDF.


Source: Stocks, Bond, Bills and Inflation. Ibbotson, et. al.


== Here are my findings ==


• You can expect (using the average returns from the return sequences) that you will have about 85% more total spending power from stocks than from bonds at the end of 10 years. That’s a lot! I average the results for the 76 return periods and find that stocks more than doubled in real spending power, while bonds increased by about 25%. Stocks great 5.5 times more than bonds.


• Stocks returned more than you started with more often than bonds. Stocks returned more than you started with in 66/76 cases: I translate that to the chance are 7 out of 8 that stocks return more than you start with. Bonds returned more than you started with in 45/76 cases: 6 of 10 chances. (I highlight these years on the PDF.)


I flip those numbers: stocks returned less than you started with in 1 in 8 chances; bonds returned less than you started with in 4 of 10 chances.


It’s better for bonds if one looks at the return periods ending the last 35 years; that’s the most favorable period for bond returns; they started their climb out of decades of 0% cumulative return. In the last 35 years, bonds always returned more than you started with in the prior 10 years; stocks returned less than you started with in three cases. Those three cases hold parts of two the four worst patterns for stock returns since 1926: the very steep declines in 2000, 2001, 2002 = -42%; and 2008 = -37% real return.


• Bonds returned more than stocks in 15 out of 100 cases: bonds returned more than stocks in 11/76 cases. The detail is on the PDF. Most all of those cases were when stocks returned less than 0% over the ten years. (Those are periods in the 2000s and those in the 1970s; the steepest decline for stocks since 1932 was 1973, 1974 = -49% real return.) The two best 10-year sequences for bonds relative to stocks were the two 10-year periods ending in 2008 and 2009: bonds returned twice as much as stocks.


• I flip this: stocks returned more than bonds in 85 of 100 cases: stocks returned more than bonds in 65/76 cases. In those cases, stocks doubled the return from bonds.


• Bonds returns were greater than the average return for stocks in 1 in 30 occasions (2/76).


== What do I conclude ==


I conclude the odds clearly favor stocks. I can’t construct a logic that says you should hold bonds for a 10-year (or longer) holding period. If you are ten years or more years from retirement, you should be 100% invested in stocks. That gives you the best odds to have more at the start of your retirement plan and thereafter. When you reach that 10-year mark, transition in a way that feels comfortable to you from 100% to your design mix at the start of your retirement plan.


== It’s just for a small slice of your portfolio ==


If you think about it a bit differently, you’re not making one 10-year decision on your total portfolio. You could think of your portfolio as divided into many future holding periods. In our example, the shortest holding period is ten years. You’re really making a number of decisions as to how to invest small slices of your portfolio; each slice has a longer holding period.


Let’s assume Patti and I had Nest Egg Care and worked through our retirement plan in 2004, planning our first full withdrawal in late 2014 for our spending in 2015. Let’s assume we found that in 2014 we would sell 4% of our portfolio for our spending. (It was actually 4.4%, but it’s simpler to use 4% in this example.) I could have viewed that I had a 4% slice of our portfolio in 2004 that had a 10-year holding period. I’d assume the next year – late 2015 – we’d sell a second 4% slice; that slice would have an 11-year holding period. And so on. I’d have a total of 25 slices with holding periods ranging from 10 to 35 years – to 2039.


The odds more obviously favor stocks and not bonds as the holding period lengthens. For example, there is no case where bonds outperform stocks if the holding period is 18 years or more. If I thought that way, I’d be much more confident in holding 100% stocks if I was ten years from retirement.


== I didn’t have the end point in mind ==


I had no financial retirement plan until Patti and I were basically retired. I couldn’t logically work back from the end point of the start of our retirement. Fortunately, my historical pattern of investing paid off. I’d been 100% stocks for decades, and I was 100% in stocks in 2004. Without thought, I remained 100% in stocks until the start of our retirement. I just changed in a matter of weeks in late 2014 from 100% stocks to 85% stocks.


My lack of transition or glide path did not hurt. Working backwards, stocks outperformed bonds for every holding period. I always earned more by having stocks and not bonds. My sudden transition from 100% to 85% could have not been better.


Conclusion: Nest Egg Care helps you make the key decisions for your financial retirement plan. One is your mix of stocks and bonds. I recommend you pick between 75% and 85% in Chapter 8. I picked 85% for Patti and me. This post asks, “What mix of stocks should I have before retirement?” It is always more than your mix at the start of retirement. This post examines the odds of having more in 10 years from stocks rather than bonds. I conclude you should be 100% in stocks all years up to 10 before the start of retirement. You can transition from 100% – changing your mix bit by bit; the exact pattern is not critical – to get to your design mix at the time you take your first full withdrawal from your nest egg for spending.


How do Fidelity index funds compare to Vanguard’s?

Every January, I complete the Morningstar nine-box display of returns for segments of the market: the box is a matrix of annual returns by company size category (Large, Mid or Small Cap) and investment style (Value, Blend, or Growth). I did not realize that Fidelity has a similar lineup of funds for each box. In this post I compare the nine-box using Fidelity funds with Vanguard funds. I conclude that returns for their index funds in each of the nine boxes are very similar but not identical: they aren’t trying to track the identical benchmark indices. I also add an update on returns for US total stock market funds. Patti and I own one of these, FSKAX.


== The style box and 2020 returns ==


Last January I displayed 2020 US stock returns for the nine-box using Vanguard funds:


In 2019 Fidelity added four funds that complete their offerings in the nine-box. I did not realize that I could fill the nine-box with returns from Fidelity funds for 2020. I duplicate the nine-box using Fidelity funds:


The returns from the two do not exactly match. The Fidelity fund was greater return in five cases and the Vanguard funds was greater in four cases. The differences are due to two factors:


1) Fidelity and Vanguard aren’t trying to match the same benchmark indices for the boxes. Fidelity tries to match benchmark indices structured by S&P Dow Jones. Vanguard tries to match indices structured by CRSP. (Morningstar shows mutual fund performance compared to benchmark indices structured by Russell.) The three index companies have slightly different definitions of the stocks that comprise a box. They’d differ on the number and specific companies in their large cap growth index, as an example.


2) Fidelity and Vanguard both try to overcome the inefficiency from having to hold some cash for potential redemptions and overcome their expense ratio. The expense ratio for the Fidelity funds are about .025% less than Vanguard’s for each fund. They may use techniques that may employ derivatives, for example. They are better at this task in some years than others. Their tracking error – how close they exactly come to the benchmark they are trying to match – varies year-by-year.


== Two common indices they track ==


I find two rigidly defined – or pretty rigidly defined – indices that they both try to match.


• The S&P 500 index is precisely defined – the composition of companies that comprise the 500, the weight of each, and the timing of new additions and deletions. Returns for their 500 funds are almost identical. Fidelity’s lower 0.025% lower expense ratio has been in place since August 2018.


• The S&P Dow Jones and CRSP indices for US Total Stock Market have to be almost identical; they both have to track the same total number of stocks and should calculate identical weights. Vanguard follows more stocks in its fund than Fidelity. Fidelity uses a sampling method for the 150 or so smallest capitalization stocks. Returns for Fidelity and Vanguard are very close.


That 0.03% difference in annual percentage return for the past decade translates to a small difference in portfolio value. The difference over a decade is is about $100 per $10,000 invested. That averages to $10 per year; that would translate to $100 per year per $100,000 invested.


This dollar difference is over a period of real returns that were about 75% greater than expected returns: about 12.6% real return vs. 7.1% expected return. I would expect the dollar difference to be much smaller at expected returns.


Patti and I own FSKAX. I think Fidelity’s expense ratio was greater than Vanguard’s for years, and that could explain the difference for FSKAX’s lower 0.03% return rate. I will stick with FSKAX. It’s my only Fidelity fund for all that I have at Fidelity. I think I owe them its small expense ratio – even if that nets me a little less return.


== Six US total stock market funds ==


I displayed performance results for five US total stock funds in my post this April. I did not include Fidelity’s US total stock market fund with 0% expense ratio, FZROX. It’s close to having a three-year history now. I add it to the list and show the cumulative return for six funds for almost three full years. FZROX cumulatively has returned about 0.10% more than FSKAX. The slightly greater return probably reflects its slightly lower expense ratio and good fortune in its sampling of the smallest securities that it does not own.


Conclusion: I did not realize that Fidelity has a line up of index funds that fits into the nine-box of segments of the market, the matrix of funds by focus of capitalization of stocks it holds (large, medium or small cap) and classification of the nature of the stocks a fund holds (value, blend or growth). I compare the Fidelity funds with Vanguard’s. Returns for each box are very similar, but they differ because they aren’t trying to match the exact same benchmark index. I also update a display from early April that now shows the returns for six US total stock market funds.

How many years does it take for you to pay out 100% of today’s portfolio value as fees?

Many of my friends don’t have the inclination, confidence or basic spreadsheet skills to be self-reliant investors. They hire a financial advisor so they don’t have to deal with what are very simple tasks for us nesteggers. The time they’d invest to gain modest skills to become self-reliant is likely worth $100,000s. This post expands on a post of three weeks ago: purpose of this post is to describe how to calculate the impact of investing costs on expected future portfolio value. In the example in this post, an investor will effectively pay out ALL of today’s total portfolio value in fees in 25 years.


== The correct way to judge added fees ==


You can’t just look dollar fees paid per year. While the fees you pay are a small percentage of your total assets, they are a much larger percentage of the expected return rate of your portfolio. Your net return rate is lower. The dollar difference from the lower rate grows exponentially. Given enough years the dollar difference in your portfolio will equal the current value of your portfolio.


You should look at it this way: you’re transferring a piece of your portfolio each year to financial professionals – to an advisor and/or to highly paid fund managers if you’re not a nestegger, only investing in index funds. You’re missing the accumulated growth of each piece that you transfer. In concept those professionals invest what you transfer to them each year in a portfolio just like yours without their costs. They accumulate wealth. The amount they accumulate will be many more times the annual payments you make to them. Their gain in wealth is your loss in wealth.


The correct questions to ask are, “What lower percentage return rate do I get to keep because of my investing costs? What’s the impact of that lower return rate in terms of lower portfolio value over time? Am I really getting that much value for what I am paying?”


== Add your total Investing Cost ==


When you invest in a mutual fund or ETF and when you hire an advisor, you incur fees that the financial industry charges fees as a percentage of assets under management, abbreviated as AUM. (You can find advisors who simply charge an hourly fee, which seems a hell of a lot fairer to me; I’ll discuss this in a future post.)


Most folks who hire an advisor think that cost is small – “just 75 basis points,” as a friend of mine told me. Several of my friends have NO IDEA what they pay; this makes ZERO sense me, since the fees are right at the top of their household expenses.


Total Investing Costs also include fund fees – their expense ratio.  Actively managed funds have higher expense ratio than the index funds that we nest eggers have in our portfolio. An advisor likely designs a portfolio with at least some actively managed funds. That’s a bet that these fund managers can somehow beat the market to more than overcome their higher costs; we nest eggers know that that’s a poor bet – that’s playing a worse than a zero-sum game. When we add cost to find our total investing costs, we have to assume active fund managers just match market returns before consideration of their costs, and therefore total Investing Costs have to include 100% of their expense ratio.


My “just 75 basis points” friend sent me his recently redesigned portfolio, and I calculated 0.30% as his weighted expense ratio for his funds. I’ll therefore use his total Investing cost of 1.05% in this example (0.75% + 0.30%). I compare that to ~0.05% that we nest eggers spend.


== Direct reduction in your return rate ==


Your investing costs are a direct reduction in the gross return on your portfolio – the expected return before consideration of any investing costs. (The percentage costs likely works out to a little bit lower net return to you than that simple subtraction, but let’s go with that.)


We need to find the impact of that added one percentage point cost on the future value of a portfolio. I’ll use my mix of 85% stocks as the base case for the example: the future expected real return rate using low-cost index funds is 6.4%. One percentage point added cost lowers the net return rate to 5.4% – a 16% reduction in the expected growth rate for this portfolio.


I use long run historical average real returns for future expected returns. I average expected returns for Long Term and Short Term bonds; almost no one owns a portfolio of solely LT bonds.


== The differences compound ==


I did two calculations in the post two weeks ago to find out how much portfolio value I was giving up over time: I used Excel’s Future Value calculation for two different returns rates and subtracted the two to see the difference in portfolio value over time.


In our example, the amount paid in a year – 1% of a starting $100,000 equals $1,000 – may not look that significant for a few years. The effects of compound growth are small. The growth portion of a portfolio in five years is small relative to the initial $100,000.


In five years our 6.4% return portfolio has grown by ~$36,000. The 5.4% portfolio has grown by $30,000. The percentage difference in the growth portion is close to the 16% return difference, but the difference in total portfolio value is less than 5%. The $6,000 dollar difference in portfolio value seems reasonable compared to that starting $1,000/year fee. In effect our investor has paid out 6% of his initial portfolio as fees.


Time and compounding magnifies the difference in returns. The growth portion in 20 years is roughly double the initial $100,000.


In 20 years, the 6.4% return portfolio has grown by $244,000. The 5.4% return portfolio has grown of $185,000. The difference in the growth portions is 24%. The difference in total portfolio value is now 17%. The $59,000 dollar difference in value means that our investor, in effect, has paid out 59% of his initial portfolio as fees.


I can add more years in the calculations and find that in a bit more than five more years – +25 years from the start – the difference in portfolio value equals today’s portfolio value in spending power. Our investor has effectively paid out ALL of today’s portfolio value in fees.


(I would get the same answers when I fight through the logic and math of calculating the future value of the growing stream of fees paid – Future Value of Growing Annuity or FVGA.  An explanation is here and a calculator is here. The logic of the calcuation is much clearer to me when I do it my way – subtracting the difference in future values.)


== What’s value? ==


Folks have to decide on the value they will get from added investing costs. I think you cannot assume value – net returns greater than index funds – from actively managed funds. A non-obvious cost of advisors is their tendency to put investors in actively managed funds that will return less than index funds. I see the biggest advantage of advisors as preventing folks from making bad mistakes. A friend told me she sold all her stocks in her retirement accounts right before the election, and by the time she got back in the market, she missed 10% return. That’s a bad mistake that will compound to much lower portfolio value in the future. An advisor who would have prevented her from doing that would have provided real value.


Conclusion: The fees an investor chooses to pay that are greater than about 0.05% AUM almost certainly result in lower future portfolio value: the added percentage cost is a direct reduction in the return rate that the investor would otherwise receive. In effect, an investor is transferring a bit of wealth potential from his or her portfolio to financial professionals: in concept they invest it and the amount grows to their future wealth, not yours. This post describes the way to calculate the impact of fees on a portfolio. In the example, an investor effectively pay out ALL of his or her initial portfolio as fees in 25 years.

Part 2: Is your retirement portfolio at its peak value for the rest your life?

Two weeks ago I read this article “The Long-Term Forecast for US Stock Returns = 7.5%”. When I adjust for the assumption for inflation, the article forecasts a ~5% real annual return for stocks vs. the historical average of ~7%. That’s 30% lower ((5-7)/7). The purpose of this post is to explain how this and other forecasts are telling us to “Throw away what you think is normal based on history. It’s a very different, far less attractive future.” I also want to explain what 5% real return for stocks means for the decisions for our financial retirement plan.


Here’s the answer to the question for those of us who are retired: assuming long-run, real returns for stocks will be about 5% (And the forecasts are 0% real return for bonds.), your portfolio value today is AT OR NEAR ITS PEAK FOR THE REST OF YOUR LIFE. Your retirement portfolio WILL NOT GROW in real spending power over time, because the expected return rate for your total portfolio is LESS THAN the percentage you withdraw each year for your spending. But I conclude, as I explain later, those forecasted, lower return rates do not affect your age-appropriate Safe Spending Rate (SSR%; Chapter 2, Nest Egg Care [NEC]).


Example: if I use 5% for the future real return rate for stocks and the 0% predicted for bonds, the expected return rate for my investment portfolio is 4.3%. If you have a lower mix of stocks than Patti and I have, your expected return rate would be less.


Last December Patti and I withdrew 4.85% for our spending. (We’re older than most!) That’s zero chance for depletion in 15 years assuming we’re starting now on the Most Horrible return sequence for stocks and bonds in history. We withdrew more than the 4.3% expected real return on our portfolio.


I would therefore expect this year that I we would NOT earn back in real spending power what we withdrew last December for our spending in 2021. When I calculate for our Safe Spending Amount (SSA) this coming December, I’d expect that Patti and I will only be able to adjust our current SSA for inflation (See Chapters 2 and 9, Nest Egg Care.) I’d expect that pattern – no real increases in our SSA – to repeat in future years, and I’d expect our portfolio to decline in real spending power over time. (The return on our portfolio is good so far this year; we’re on track to earn more than we withdrew last December.)


I conclude that if the future is 5% real return for stocks, we all need to be happy with our current SSA, because we won’t see much of a real increase. (Patti and I are happy! Our SSA has increased in real spending power by 32% over the last six years. See here.)


== The studies of future returns for stocks ==


On this sheet that you can download I list a number of studies that forecast future returns. The forecasts haven’t changed much for a number of years. My summary is that 5% real return for the long-run average for stocks is about the average of the predictions. The prediction for bonds is about 0% future real return.


I sketch the predicted rates for stocks and for bonds on a graph. I start the new trend lines in 2015, roughly when all these predictions started. The cumulative return lines for stocks and bonds started on the predicted return lines, but both are above their predicted trend lines now. Over time the new trend lines depart widely from the historical averages.


The forecast from the studies show a departure in the long-run average returns for both stocks and bonds. I assume the studies think that departure started in 2015 for this display.


== Worse over next 5 to 10 years ==


All the studies predict corrections for stocks over the next decade to get back the cumulative return lines back to their trend lines. Most of the studies imply that stocks are over-priced by about 30%, meaning a 3-percentage point deficit in return over a decade to interest the trend line.


One of the forecasts of returns is not credible in my view. That’s -7.8% real annual return for stocks over the next seven years. That’s worse than the Most Horrible seven-year return sequence in history. And the economic forces during that period were particularly bad.


This sequence of returns is much worse than the second worst seven-year sequence of returns.


== How do they calculate 5% real return for stocks? ==


The general logic for the predictions is the same; none of them give enough details to know exactly how their model works or clearly describe impact of the factors. Each implies a logic that generally follows my text here. I think my text is clearer than any of the descriptions I read in those reports:


• “You shouldn’t base the future on the simple extrapolation of the 95-year average of 7% real return for stocks. That’s not a logical way to predict the future.


• “We built a model that identifies what drives stock returns. The fundamental drivers of returns have been corporate profitability and growth: these two drive the ultimate cash return to investors: dividends and cash returned in the form of retiring outstanding shares.


• “The future economy and company profitability are very different from the past. A key change, for example, is that economic growth – the real growth in Gross Domestic Product – is forecast to grow at 2.3% per year in the future as compared to 3.1% for the past 70 years. (I have no idea as to their assumptions on corporate profitability and I think that would have a much greater impact on future return than growth.)


• “When we put our forecasts for the key inputs into our model, our model tells us that you should expect 5% real return for stocks in the future, not 7% as in the past.”


== Where’s the beef? ==


How good are the models? How accurate have they been? Should we believe what they say? The general logic for the models makes sense to me, but the models lose credibility when the actual results vary WIDELY from the predictions. These predictions for about 5% real (or lower) returns have been around for more than five years. Real stock returns have been about 2½ times the predicted returns over the past six years.


In 2016, one of these studies forecast 0% probability that a portfolio would earn 5% real return over the decade. The real return rate for the first 4½ years has averaged 11% per year.


NONE of these reports acknowledge that actual results have been far better than their forecasts. I’d like a study to clearly state something like this: “Stock returns over the past five years have been at more than twice our predictions, and we’ve changed our model to reflect that. We now forecast ….” Or, “Stock returns over the past five years have been more than twice our predictions. We are sticking with our model, and the explanation of the return difference is that we believe stocks are now GROSSLY over-valued – by more than 50%! Stocks need to drop by about 35% from the current level to be in line with our predictions. Here’s how you know that stocks are grossly over-valued: …..”


== Implications for my plan ==


Nothing about these studies tell me to change the decisions for my retirement plan. For example, I am not going to lower the amount we withdraw for our spending. I will NOT CHANGE the age-appropriate Safe Spending Rates (SSR%) that I display in NEC. (See Chapter 2 and Appendix D, NEC.) I used 4.85% last December for our spending in 2021; I will use – actually test to see if I can use – 5.05% for this upcoming year.


Your age-appropriate SSR% is based on the assumption that you will face – starting NOW – the Most Horrible sequence of stock and bond returns in history. The cumulative real return for that sequence was 0% for stocks and 0% for bonds for 14 years. I argue that there is nothing in these forecasts that suggest we should assume a return sequence worse than that one.


But if I thought the future was 5% stock returns and 0% bond returns are the future, I’d double down on LOW, LOW investing costs. A cost of one percentage point/year is 23% of the growth at 4.3% expected portfolio return (-1/4.3). That’s a Big Bite. I can’t get much lower investing cost than I am now, about .04%.


The expense ratio of VXUS declined by .01% from the last time I looked at this!


== Those in the Save and Invest phase: UGH ==


We older folks have lived through decades averaging about 7% real return rate for stocks. If it’s a 5% future real return for stocks, younger folks have to save 70% MORE what we had to save to be as well off as we are. The Rule of 72 tells us that stocks double in real spending power in +14 years years at 5% as compared to  every ~10 years at 7%. Money invested at 5% grows ~3.5X in 25 years. Money invested at 7% grows ~6X in 25 years.


Conclusion: A number of studies forecast the future real return for stocks is 5% (or less) relative to the historical 7% real return rate. They’ve forecasted this new normal for a number of years. They’ve not been accurate: real stock returns have averaged more than double their forecasts. But the forecasts could be right.


This post explains that if the forecasts are right, you likely are at the peak of portfolio value for the rest of your life. Your withdrawal rate – your age-appropriate Safe Spending Rate (SSR%) you get from Nest Egg Care – will be greater than the expected return rate on your portfolio. You typically will not earn back the amount you are withdrawing each year.


This post explains that a long-run average 5% real return rate is not a disaster: it does NOT mean we should withdraw less for our spending. That lower average future rate does not threaten the number of years we can plan for ZERO CHANCE of depleting our portfolio.

Part 1: Is your retirement portfolio at its peak value for the rest your life?

Last week I read this article “The Long-Term Forecast for US Stock Returns = 7.5%”. The article assumes 2.5% future inflation. That means the forecast translates to ~5% real return for stock vs. the historical average of ~7%. That’s 30% lower ((5-7)/7). I can find similar predictions – some from five years ago – that are much lower than the 5% rate. Wow! Those predictions are saying, “Throw away what you think is normal based on history. It’s a very different, worse normal in the future.” I’ve assumed that the future is close to the past, but we need to understand the implications of both of these scenarios. This post discusses what we might expect if the future is like the past: new normal = old normal. That’s clearly a more comfortable future. Next week I’ll discuss those studies that forecast a new normal that is much lower than 7% real return for stocks: that will be uncomfortable!


Here’s the answer to the question: assuming future real returns roughly match the historical real 7.1% return rate for stocks, your portfolio value today is NOT its peak value for the rest of your life. Your retirement portfolio will grow in real spending power over time, because the expected return rate for your total portfolio is greater than the percentage you withdraw each year for your spending.


Example: the expected real return rate for our investment portfolio is 6.4%. Last December Patti and I withdrew 4.85% for our spending (We’re older! That’s zero chance for depletion in 15 years assuming we’re starting now on the Most Horrible return sequence for stocks and bonds in history.).


I expect this year to earn back what we withdrew in December and add 1.5% in real spending power. When I calculate for our Safe Spending Amount for next year, I’d expect that Patti and I will have more than enough for our current Safe Spending Amount (SSA; see Chapters 2 and 9, Nest Egg Care.)


Obviously, annual returns and sequences of returns for stocks and bonds vary from their long-run average rate. Returns were such that Patti and I earned back more than we withdrew in four of the last six years. Those years resulted in a real increase in our SSA for the following year. We didn’t earn back enough for a real increase in two years. (See here and here.)


== The past is 7.1% real return for stocks ==


You’ve seen this graph before. The long-run average, real annual return rate for stocks is 7.1%. That’s the average from 1926-2020; the rate would be slightly greater if I added the data from 1871. Clearly 7.1% is not a law of physics, but that’s a lot of history that I’ve viewed that as a pretty darn accurate predictor of the long-term future.


If we think the future will be like the past, we’re making the underlying fundamental assumption that corporate profitability in the future will be similar to the past: profits provide the cash that companies invest back into their business to keep pace with the growth of the economy and to pay out cash to shareholders in the form of dividends or stock buy-backs; buy-backs today are greater than dividends. That seems to be a reasonable assumption.


== Returns should migrate toward the 7.1% trend line ==


Points on the solid line of cumulative returns should migrate toward the 7.1% rate – toward that dashed trend line on the graph. When a point on the solid line is above the trend line, future returns will be lower than 7.1% to reach the dashed line. When a point on the solid line is below the trend line, future returns will be better.


== Where are we now and what does it mean? ==


The data point at the end of 2020 is slightly above the trend line. I calculate that it is 4% above the line.


If the solid line hits that 7.1% trend line ten years from now, the cumulative return from the end of 2020 to the end of 2030 will be 4% less than value of 7.1% return compounded for 10 years. That works out to 6.7% real return over that holding period. That’s going to translate to a an expected return for our total portfolio that’s still above our withdrawal rate until we are well into our 80s: our portfolio is not at its peak value.


For those in the Save and Invest phase of life, I’d assume the long-term 7.1% real return rate applies for each year’s savings that you hold for long holding periods. Following the Rule of 72, investors in stocks can expect a doubling in spending power about every ten years. I’d still think of it this way: a 40-year-old person who saves this year (2021) will spend that in the 25th year from now (2046). The amount then would be about 6X in today’s spending power, the result of 2½ doublings.


Conclusion: If you believe the future is similar to the past, you believe the long-run future real return rate for stocks is ~7% per year. Stocks dominate your portfolio, and the expected return rate on your total portfolio is less than you are withdrawing each year for your spending. At expected return rates, your portfolio will grow in real spending power and you will calculate to a greater Safe Spending Amount in future years.


The cumulative return for stocks from 1926 to the end of last year is slightly above its long-run trend line. The future return rate to get back to the trend line is slightly less than 7.1%.